What You'll Learn
- Identify the primary Elev8+ Pro labels, levels, and confirmation markers.
- Explain the role of session, liquidity, VWAP, and higher-timeframe references.
- Use the chart legend to separate context from execution confirmation.
Elev8+ Indicator: Complete Chart Legend & Visual Guide
The Elev8+ ecosystem is built to make liquidity, market structure, extension, and reversal / continuation opportunities easier to organize in real time. This page is your complete visual legend for every symbol, line, box, sweep level, and abbreviation you will see on the chart in the flagship Elev8+ Pro Indicator.
New User Tip: Do not try to memorize every abbreviation instantly. Focus on the "Power Hierarchy" section below first.
Recommended "Day 1" Setup (Avoid Clutter)
Elev8+ Pro is powerful, but turning on every feature at once can be overwhelming. We recommend this clean configuration for your first week:
- Signals: Enable Triangles and LS Labels.
- Levels: Enable PDH/PDL and the Session / Overnight highs and lows relevant to your trading window.
- Disable: Extra overlays and lower-priority levels until you understand what each one contributes.
Optional: Once this Pro legend feels familiar, you can add more layers for specific jobs (not clutter): Market Map for liquidity/structure, Market Extremes or VWAP Deviation for extension, and Momentum Gaps / Reversal Blocks / Real FVG for displacement-created zones and retests.
Elev8 Reversal Signals
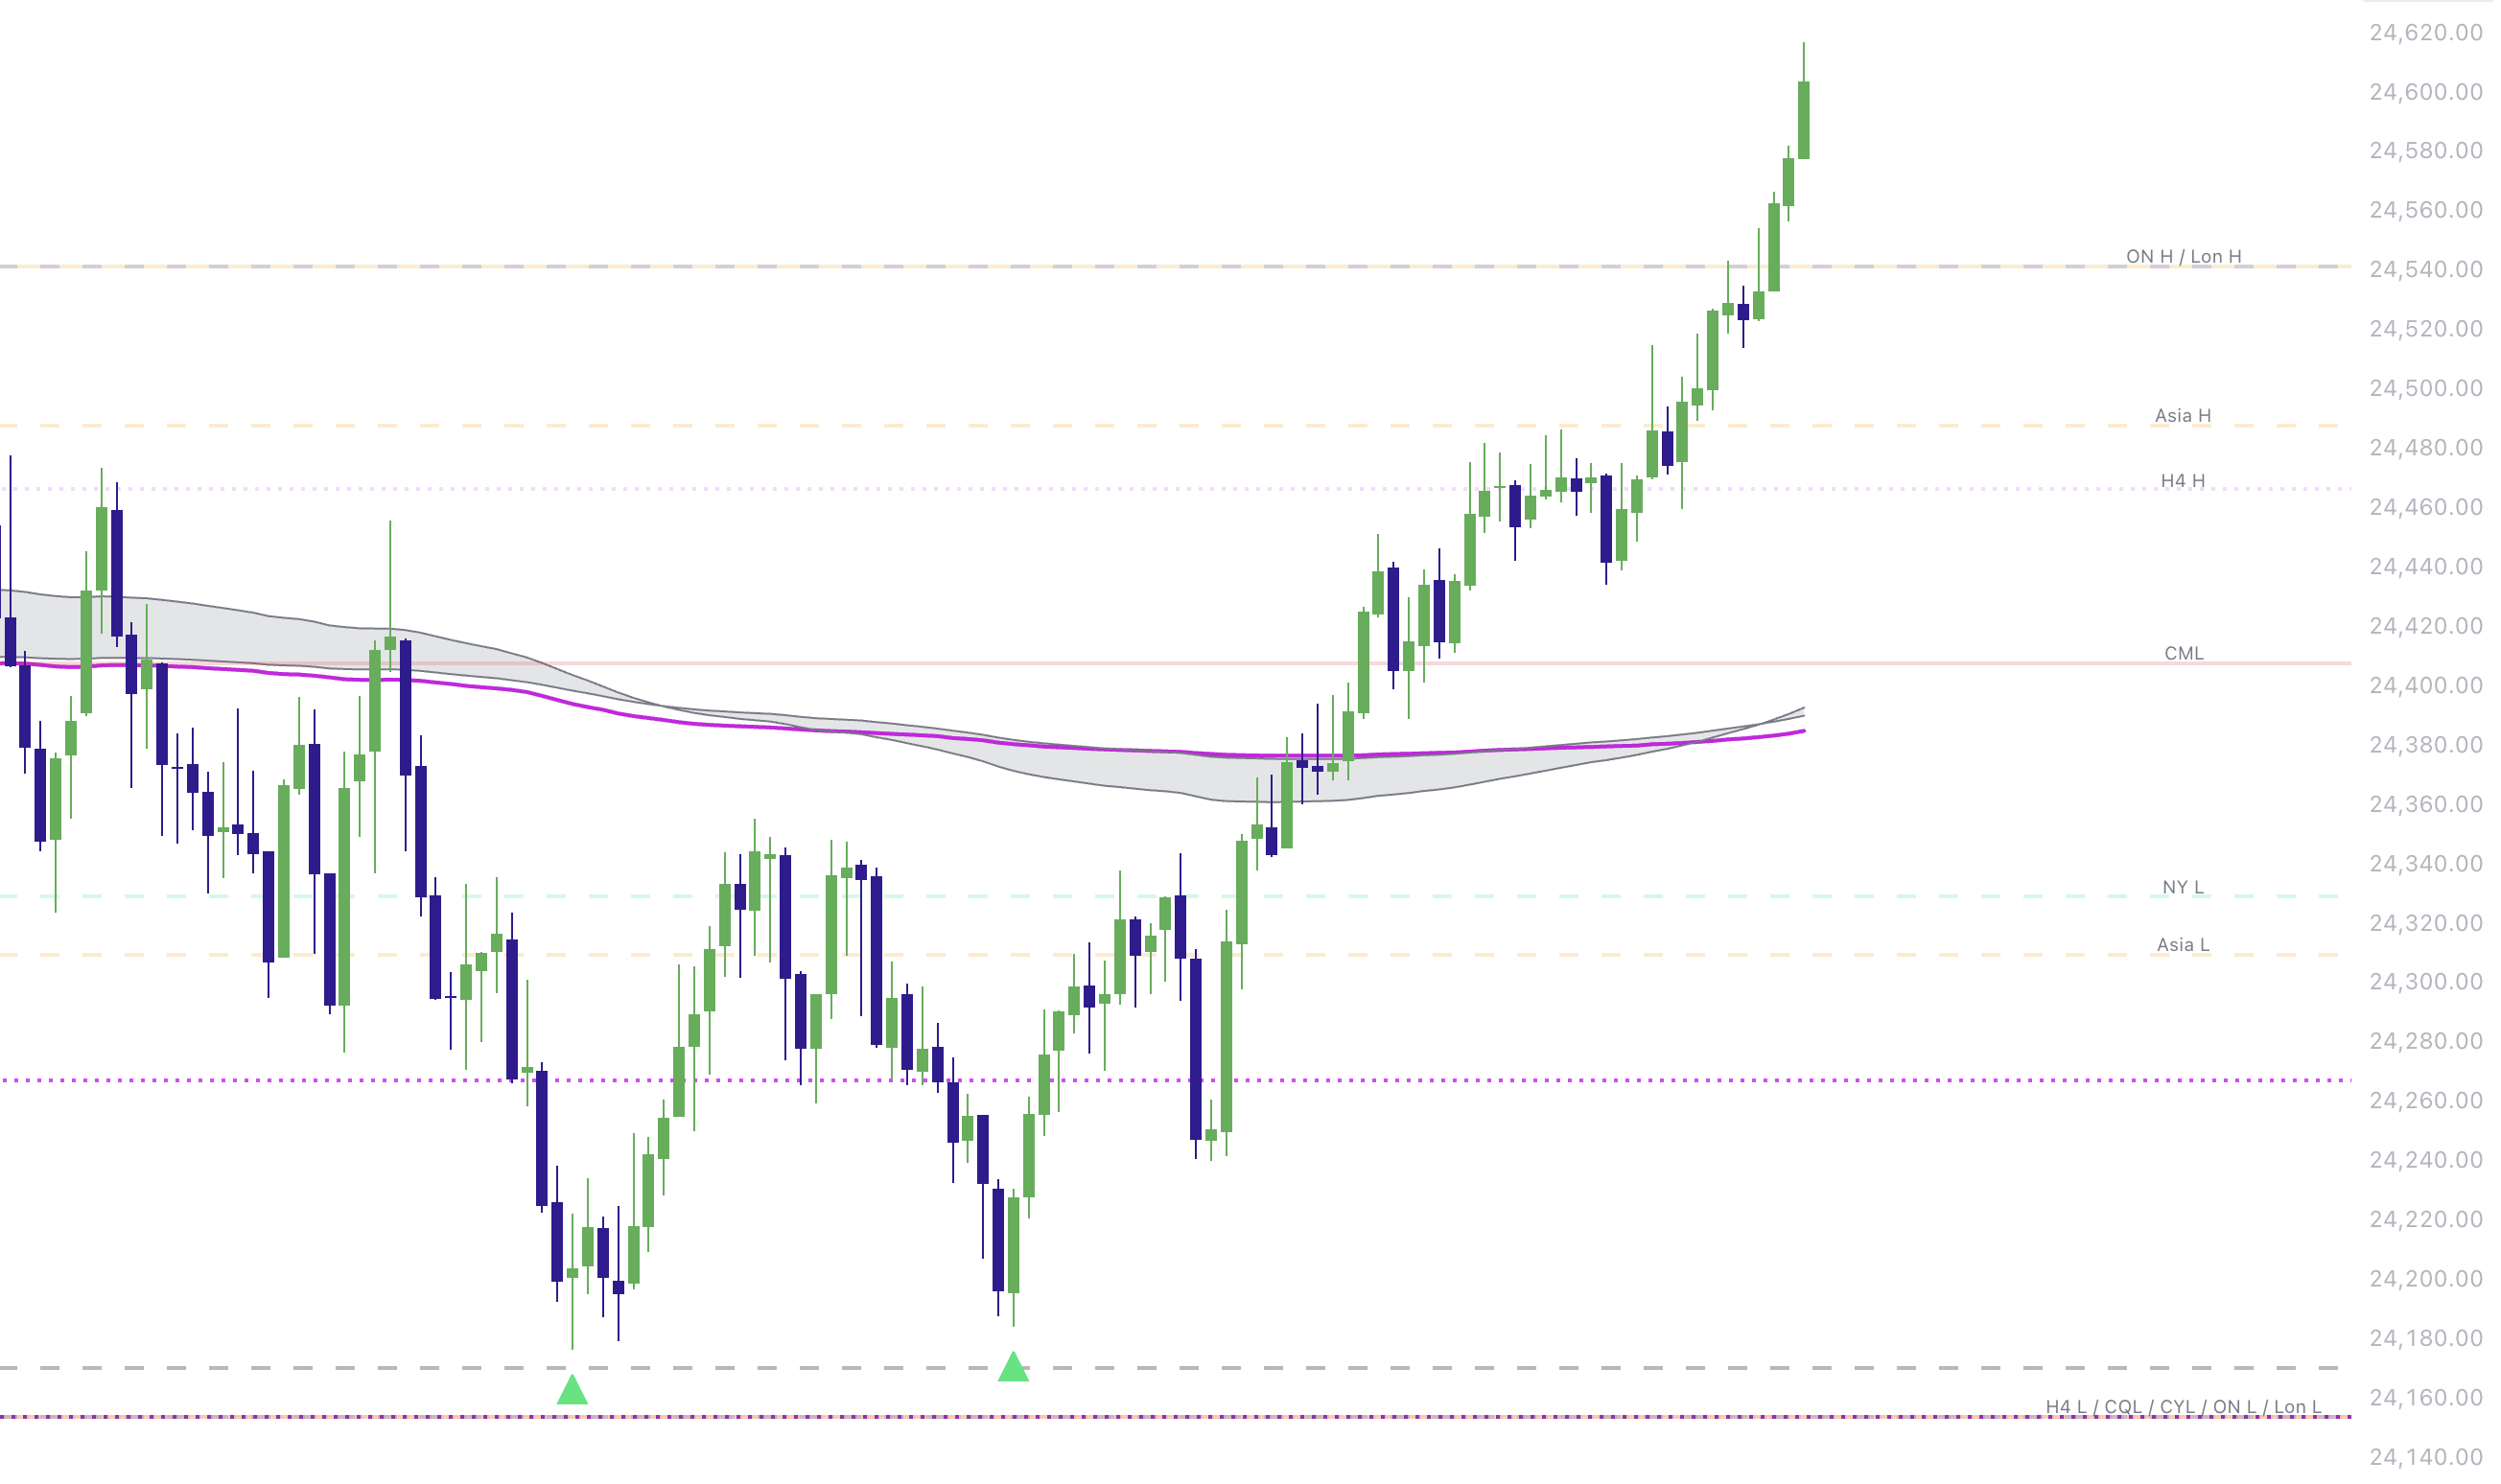
Green Triangle (Buy Signal)
A green triangle under a candle highlights a bullish reversal candidate. In practical terms, it can indicate:
- Price interacted with downside liquidity or another reversal-sensitive area
- Rejection / failed continuation began developing back toward prior structure
- Core momentum/volatility criteria aligned with a bullish reversal thesis
Tradeability Check
Triangle + Meaningful Location = Setup Candidate.
Triangle + No Context = Lower Priority.
Favor triangles that print at meaningful liquidity or structure and then prove rejection / failed continuation.
Red Triangle (Sell Signal)
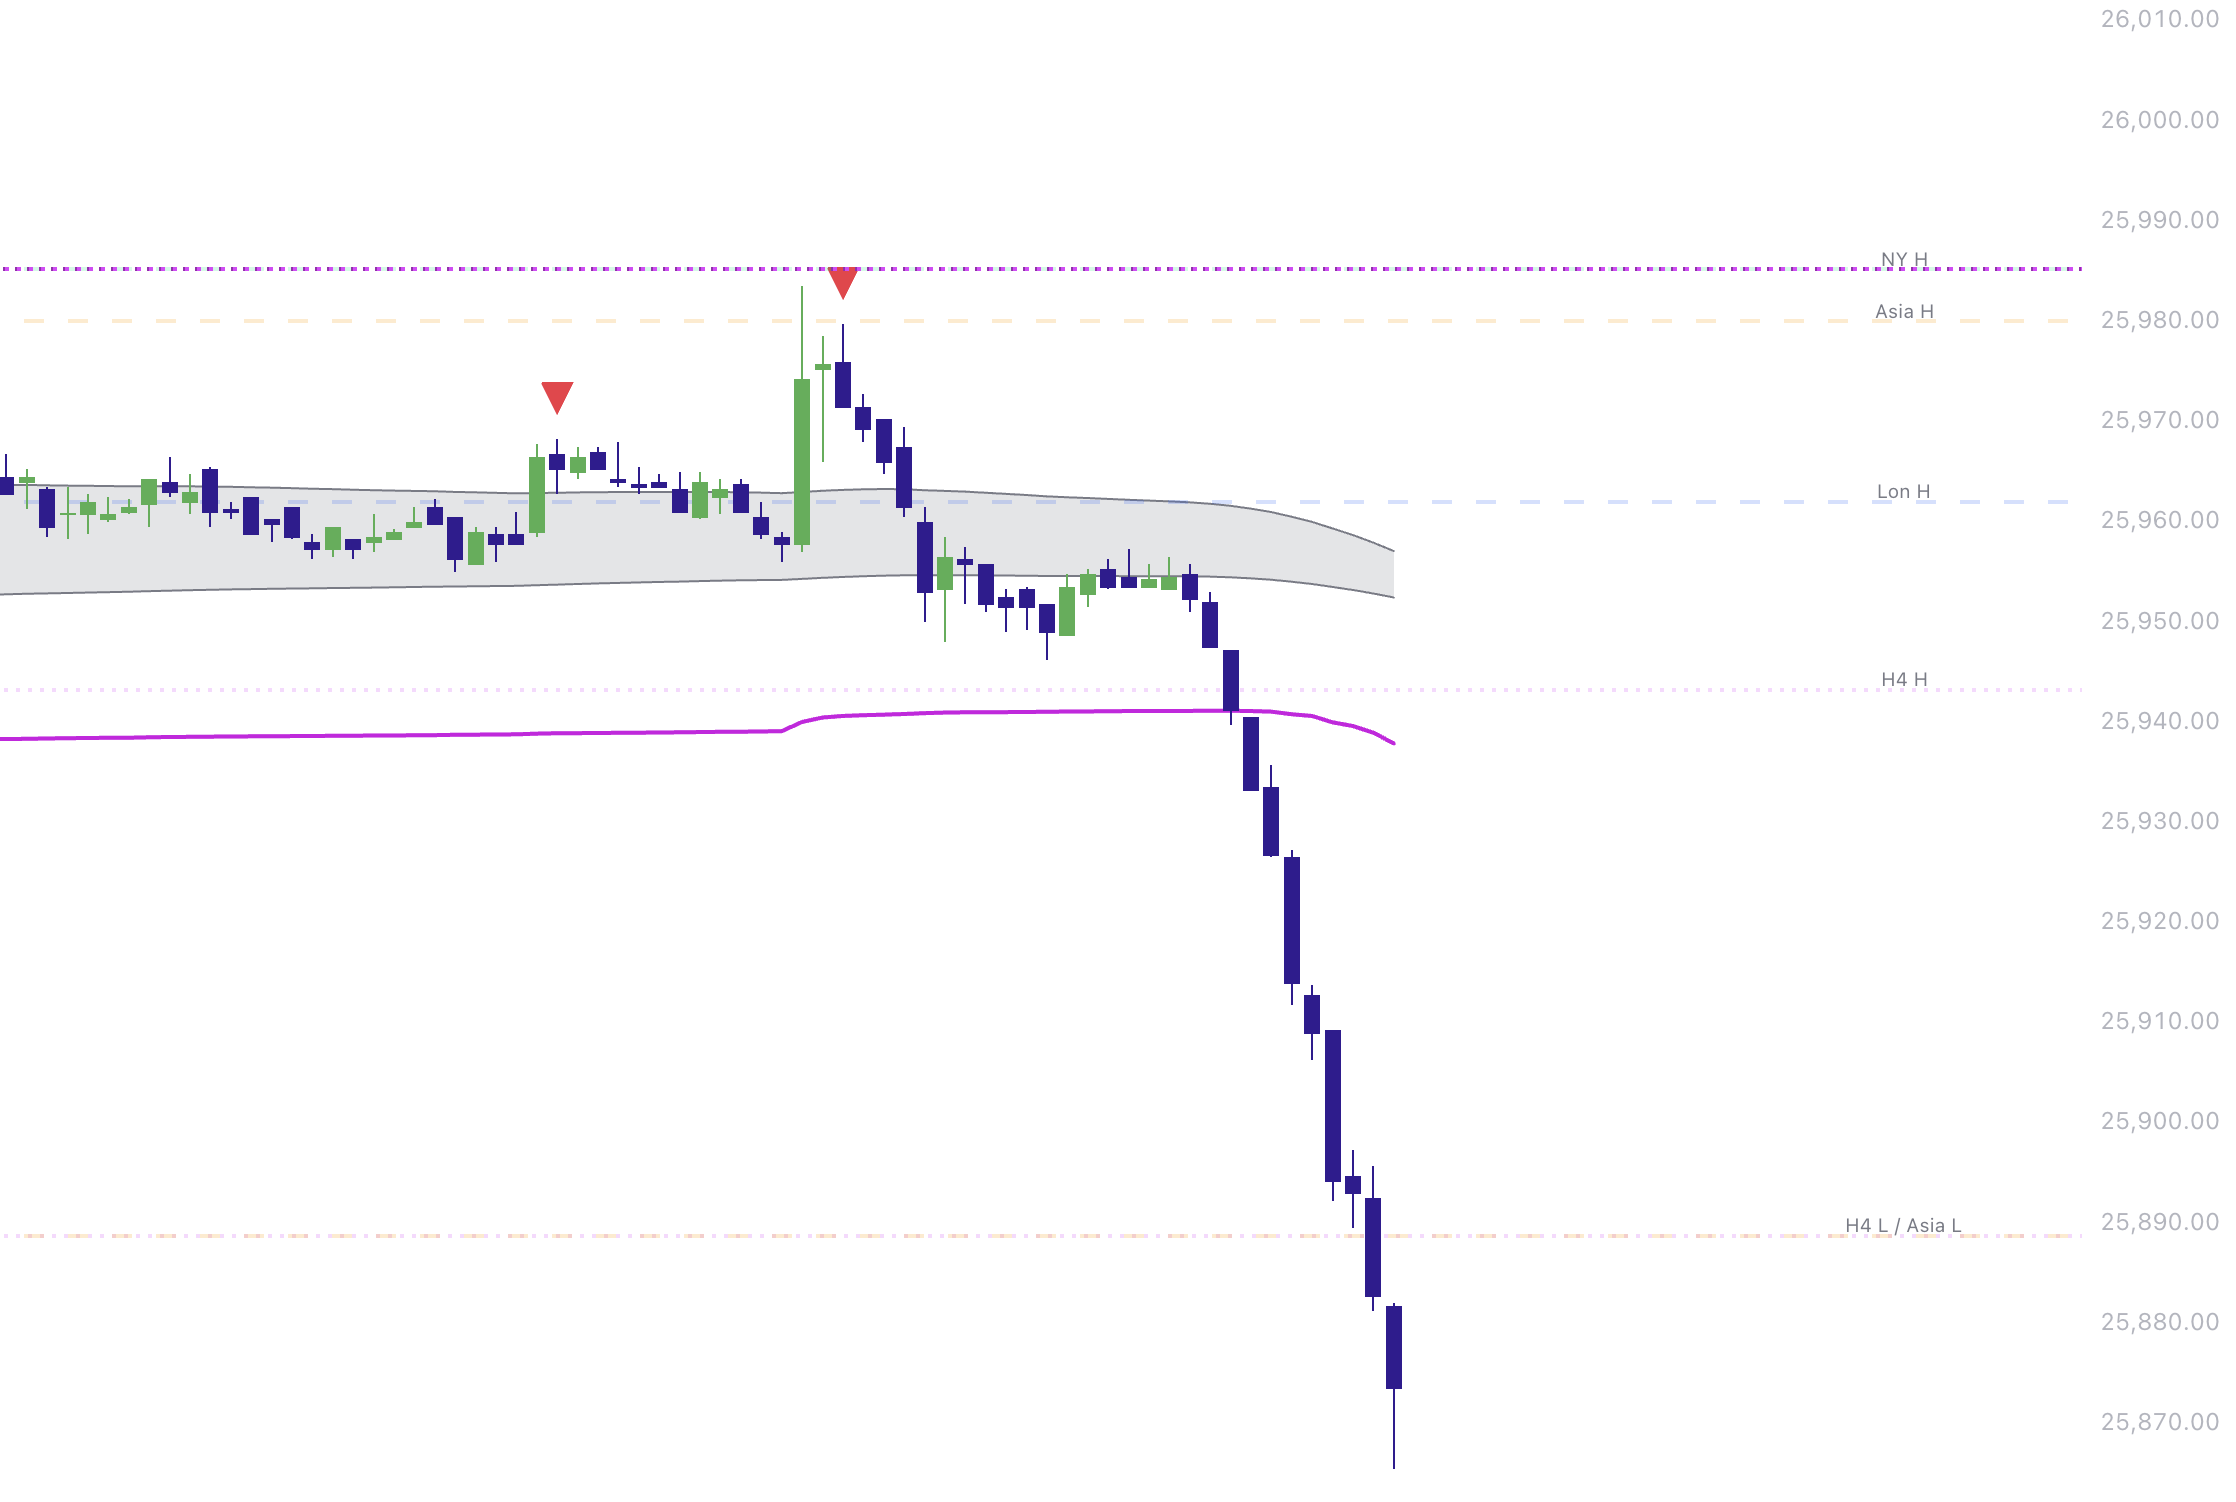
A red triangle above a candle highlights a bearish reversal candidate. It can indicate:
- Price interacted with upside liquidity or another reversal-sensitive area
- Rejection / failed continuation began developing back toward the prior range or structure
- Core momentum/volatility criteria aligned with a bearish reversal thesis
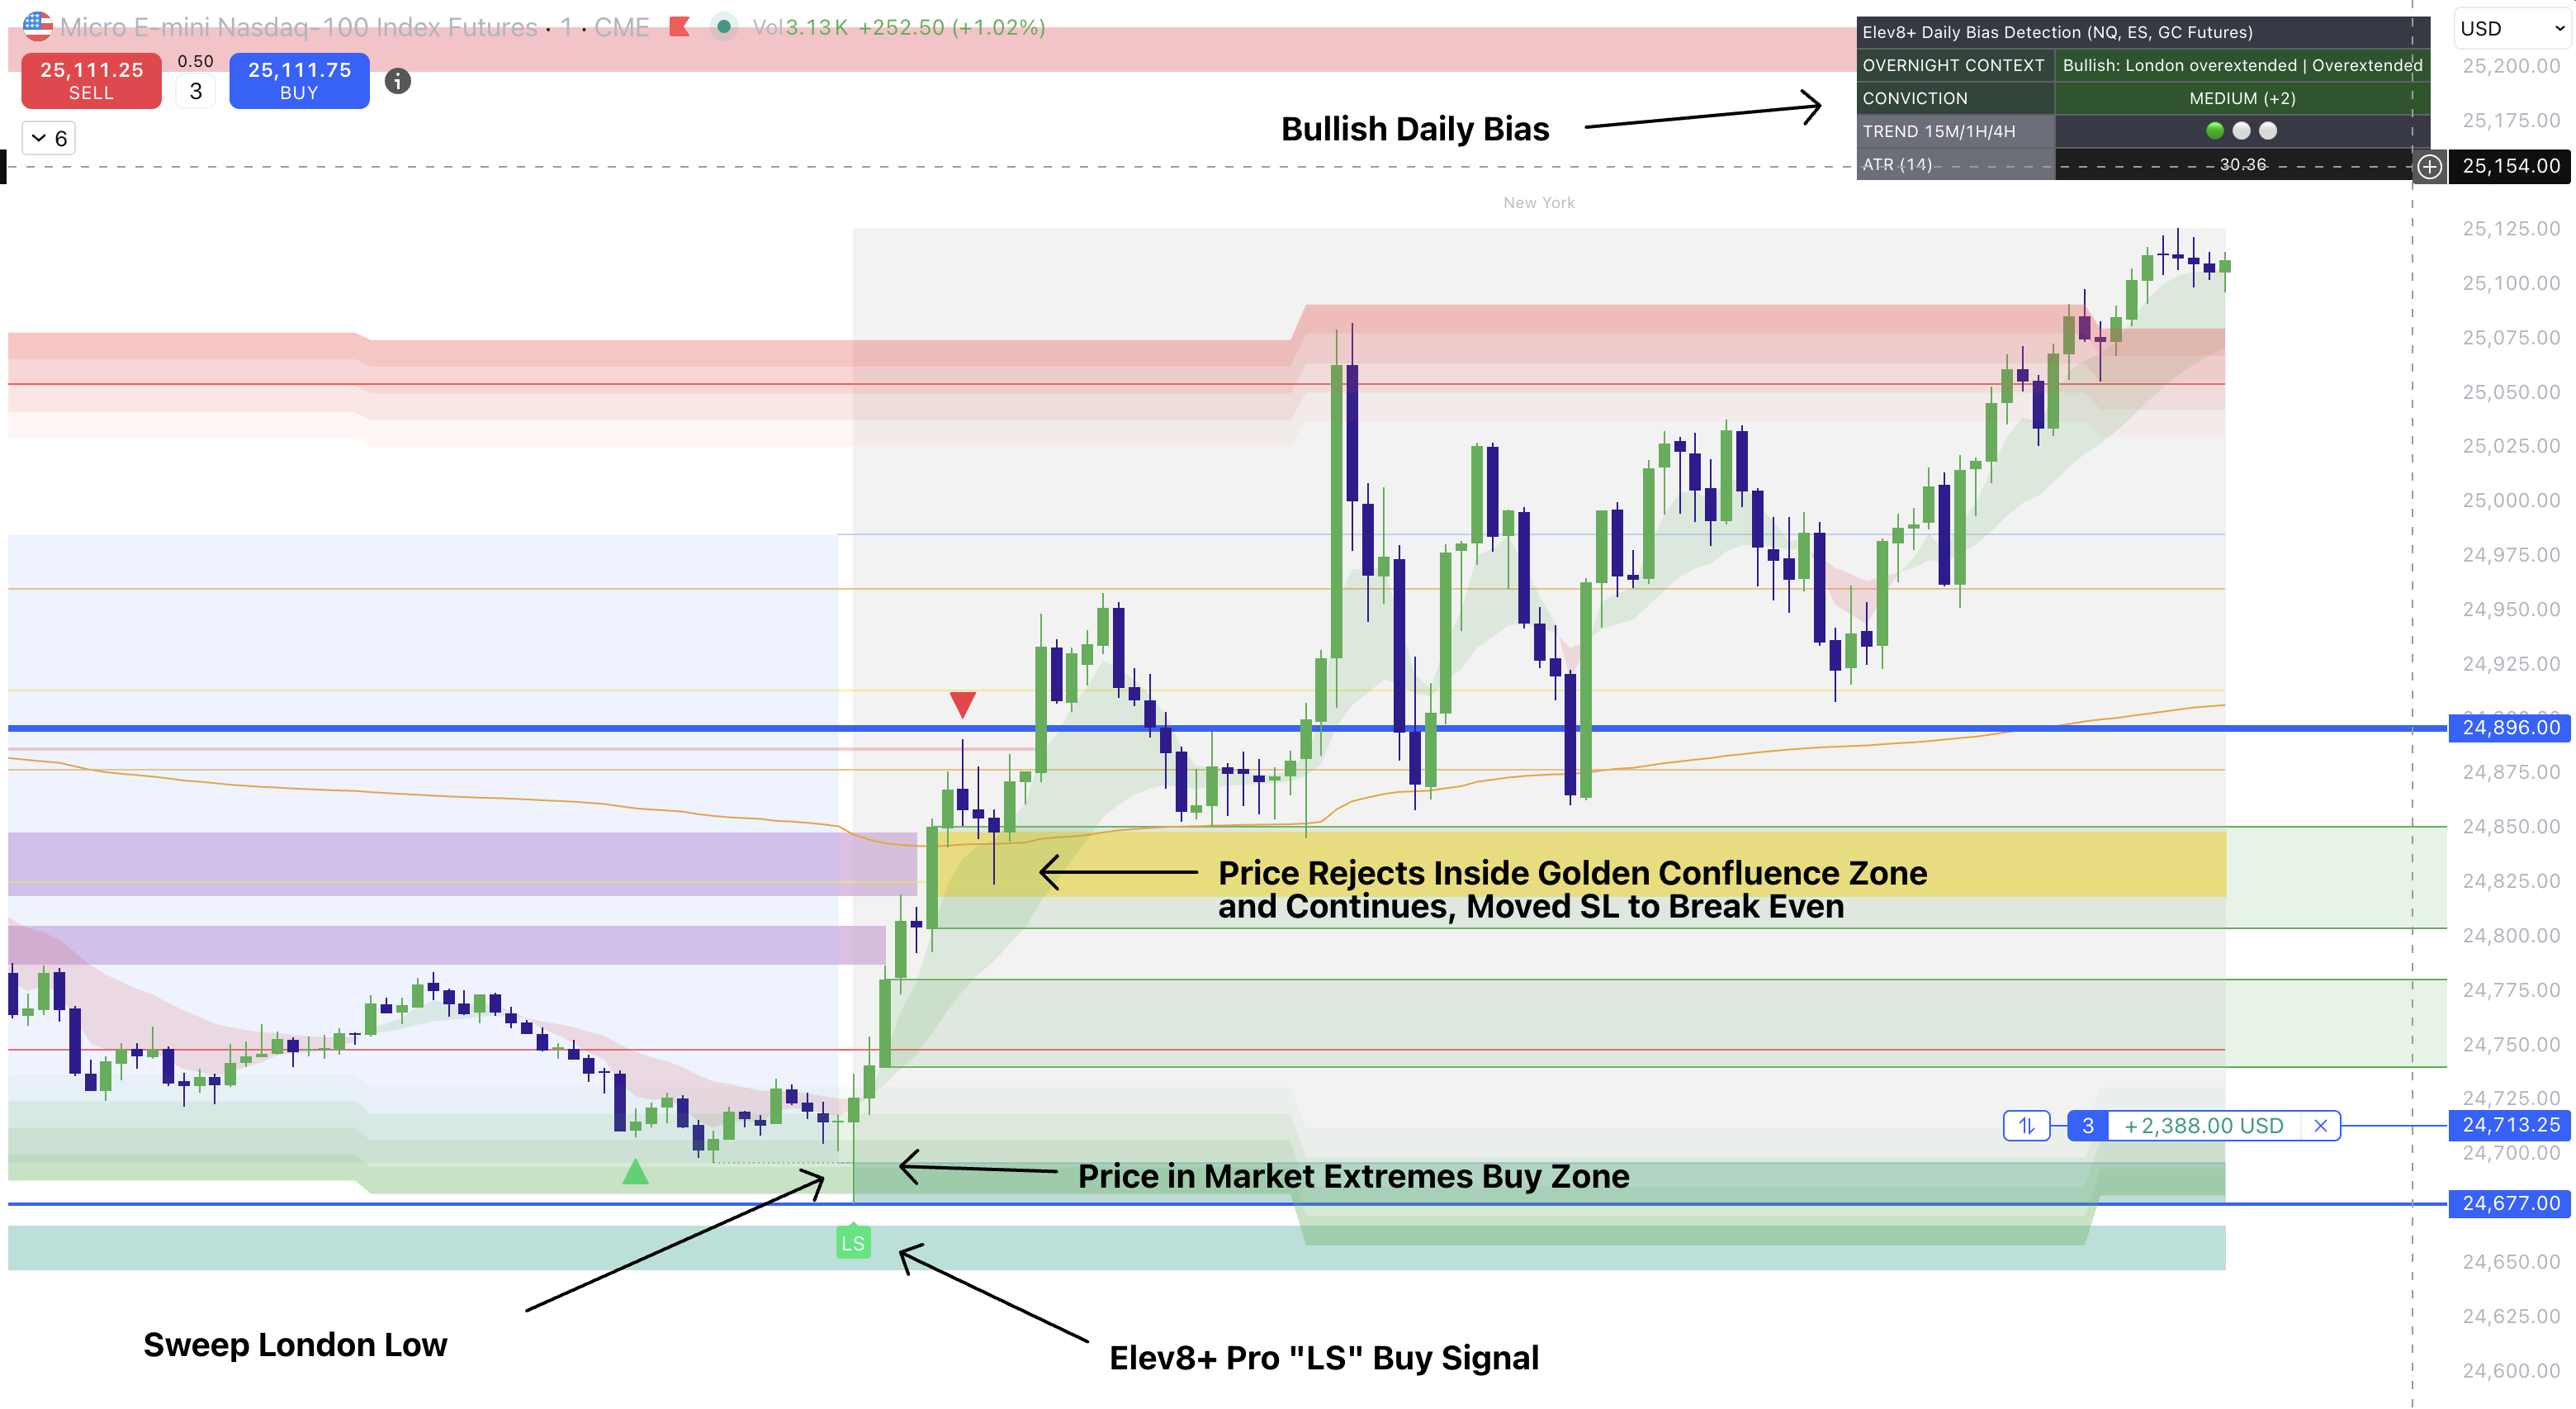
LS Sweep Signals (Sweep Box + Confirmation)
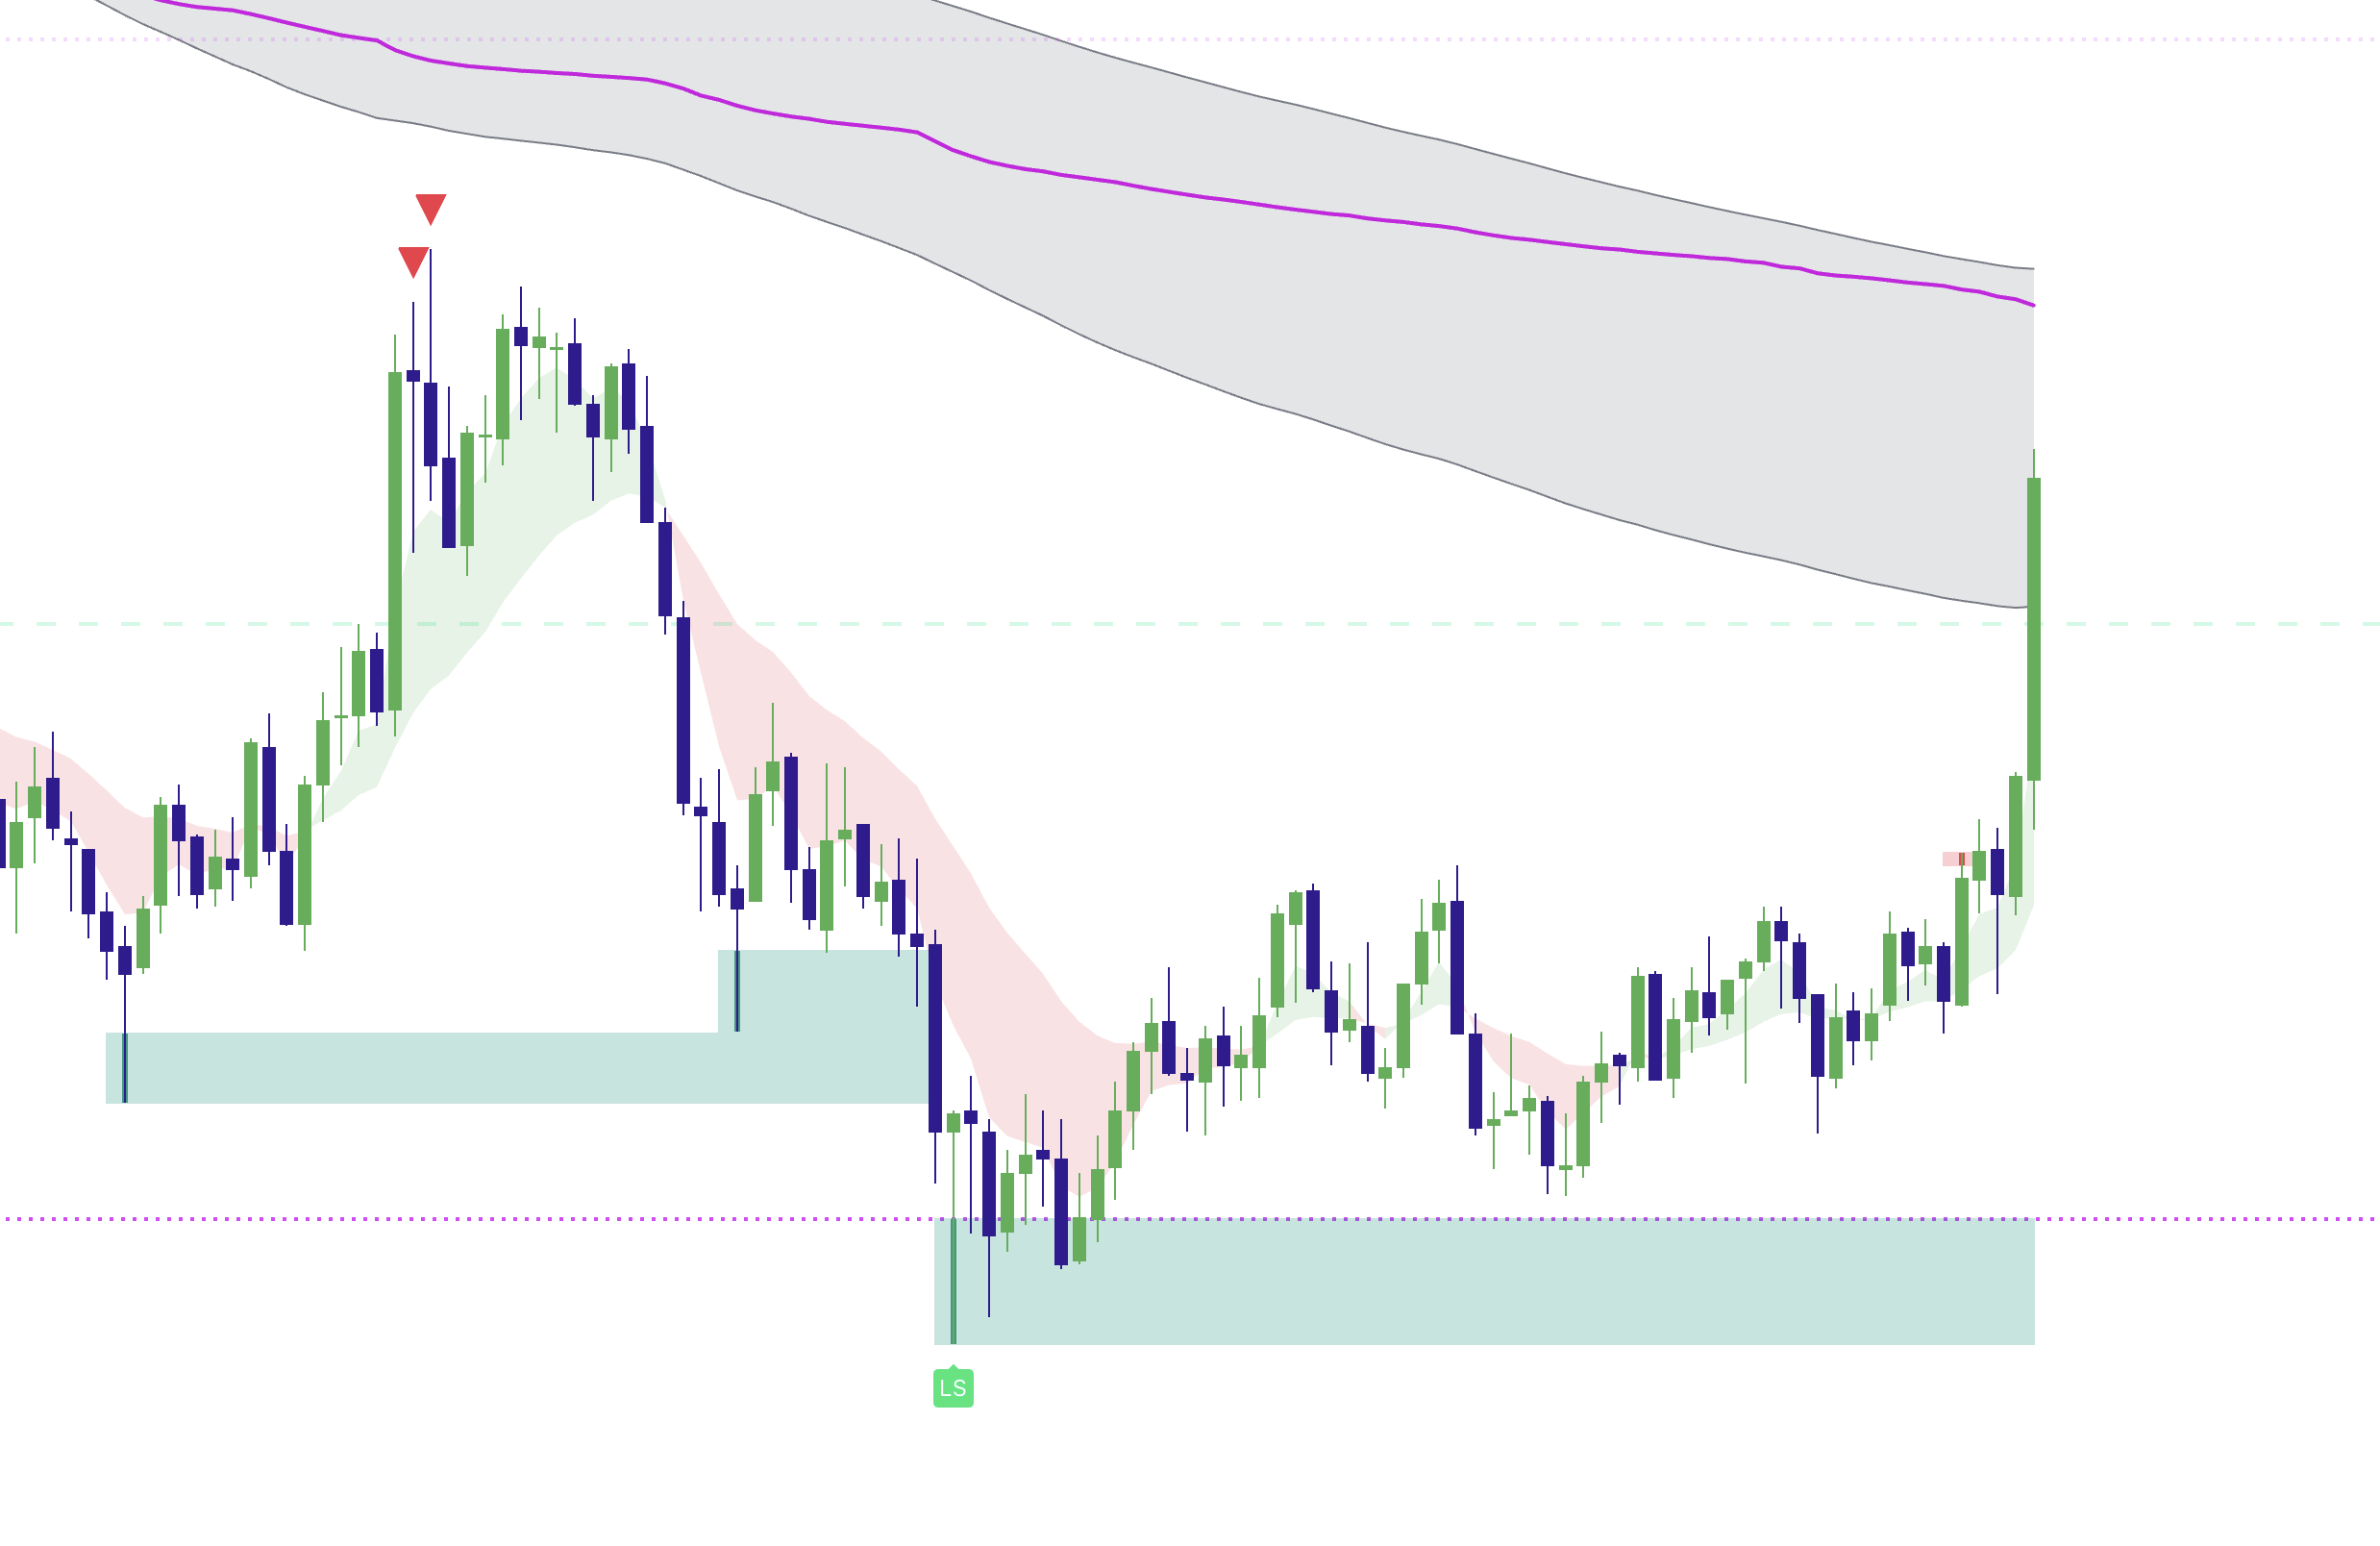
In addition to triangles, you may see small colored LS labels. These represent a more selective sweep confirmation layer:
- Green LS – bullish reversal confirmation using stricter internal qualification
- Red LS – bearish reversal confirmation using stricter internal qualification
Which one is better? Think of a Triangle as broader detection and an LS Label as a more selective confirmation layer. LS labels require stricter criteria, but neither signal replaces location, structure, invalidation, or risk management.
Liquidity Sweep Boxes
Elev8+ can draw shaded sweep boxes to highlight recent sweep / rejection zones and visually preserve areas that may matter if price returns.
These can be useful for re-tests. If price returns to a Sweep Box, let the zone prove itself again through rejection, defense, or structure before treating it as a re-entry.
- Green Sweep Box – bullish sweep / rejection zone below prior liquidity
- Red Sweep Box – bearish sweep / rejection zone above prior liquidity
The "Power Hierarchy" of Levels
Not all lines on your chart deserve equal weight. Some represent broader external liquidity, while others are more local intraday references. A practical starting hierarchy is:
- PDH / PDL (Previous Day High/Low)
- Previous Weekly / Monthly High/Low and major protected HTF swings
- ON H / ON L (Overnight High/Low)
- Asia / London / NY Highs and Lows
- 1H / 15m pivots and other intraday structure
- VWAP as a value / reaction reference
Pro Rule: Higher-timeframe external liquidity usually deserves more attention than a minor local pivot—but current trend, acceptance, and confluence can change which level matters most.
Sweep Levels+ Lines (Visual Guide)
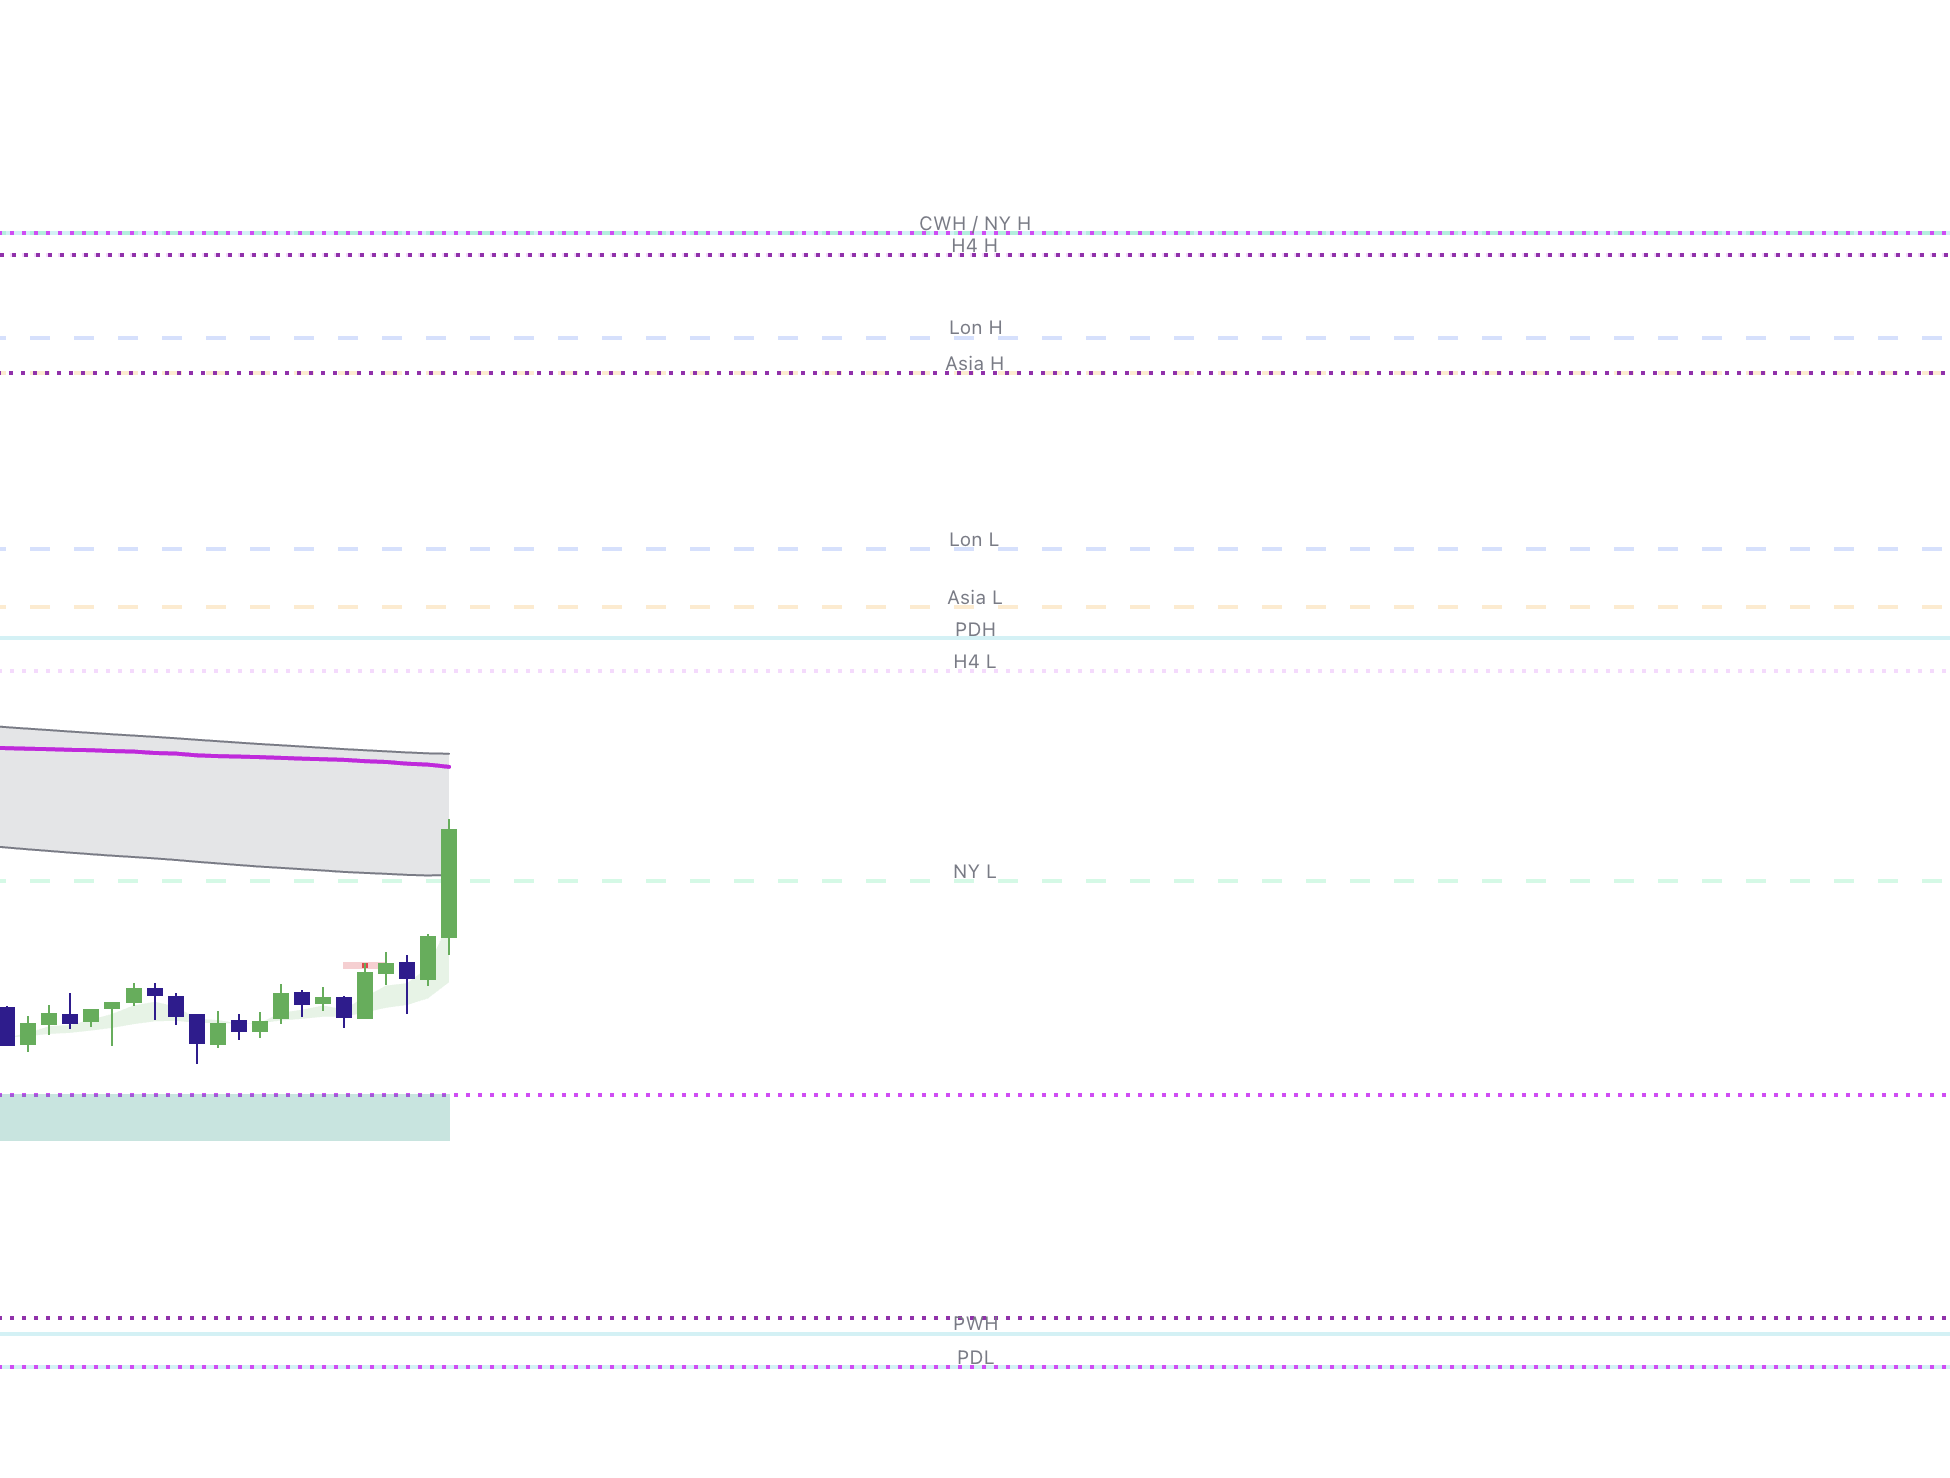
Sweep Levels+ automatically plots key liquidity magnets. Here is the decoder for the text labels you will see:
Daily & Overnight (Tier 1 & 2)
- PDH – Previous Day High
- PDL – Previous Day Low
- ON H – Previous Overnight High
- ON L – Previous Overnight Low
Major Sessions (Tier 2)
- Asia H / Asia L – Asian session high/low
- Lon H / Lon L – London session high/low
- NY H / NY L – New York session high/low
Weekly/Monthly (Tier 1 - Macro)
- PWH / PWL – Previous Week High/Low
- PMH / PML – Previous Month High/Low
Intraday Structure (Tier 3)
- 1H H / 1H L – One-hour pivot highs/lows
- 15m H / 15m L – Fifteen-minute pivot highs/lows
VWAP and EMA Bands
If enabled in your configuration, Sweep Levels+ may also display:
- VWAP – intraday value reference. Use it as a potential target, reaction area, or trend-context reference rather than a guaranteed magnet.
- EMA Bands – trend/regime context for filtering counter-trend sweeps and evaluating pullbacks.
Highest-Confluence Reversal Context
The strongest Elev8+ reversal environments tend to appear when several independent components align in the same location:
- Price interacts with meaningful external liquidity such as PDH/PDL, session extremes, or HTF structure
- A Triangle or LS label prints as failed continuation / reclaim begins
- Opposite displacement, structure shift, or a defendable RB/FVG retest supports the reversal thesis
Optional suite confluence: Market Map confirms liquidity/structure, Market Extremes or VWAP Deviation measure extension, and Momentum Gaps / Reversal Blocks / Real FVG help map displacement-created zones, retests, invalidation, and targets after confirmation.
Execution reminder
- - Signals are only one layer of the system.
- - Location, rejection/acceptance, and structure determine tradability.
- - Risk should be defined by structural invalidation.
- - Elev8+ Signals do not need to appear on every timeframe. Use higher timeframes for context and lower timeframes for execution; do not require every chart (4h/1h/15m/5m/2m/1m) to print the same signal.
Conclusion
The Elev8+ ecosystem organizes the language of liquidity: sweeps, rejection/acceptance, extension, structure, and reversal / continuation context. Once you internalize this legend—and understand which references matter most—your chart becomes a cleaner map of where meaningful liquidity sits, how price responds to it, and where a trade thesis becomes invalid.
Quick Checklist
- I can identify the primary Elev8+ Pro labels, levels, and confirmation markers.
- I can explain the role of session, liquidity, VWAP, and higher-timeframe references.
- I can use the chart legend to separate context from execution confirmation.
Before You Move On
Apply the lesson on your own chart or dashboard and confirm that you can explain each step without relying on the article.
Common Mistakes
- Turning on every feature before learning the core chart language.
- Moving on without testing the lesson on a clean chart.
Next Recommended Lesson
How Liquidity Sweeps Work on NQ Futures: The Complete Playbook for Reversal Traders →