
What You'll Learn
- Recognize buyer and seller exhaustion and divergence conditions.
- Interpret higher-timeframe extension zones without automatically fading them.
- Combine regime and extreme context with qualified price confirmation.
Market Context • Exhaustion + Statistical Extremes
Elev8+ Market Extremes: Identify Exhaustion, Statistical Stretch, and Better Reversal Context
Most traders get into trouble by chasing a move after it is already extended. Elev8+ Market Extremes helps you identify when buying or selling pressure is becoming stretched and the risk of a pause, rotation, or mean reversion is increasing. Use it as your exhaustion + extension context layer, then require price rejection and Elev8+ Pro reversal triangles as your execution trigger—especially when the extreme also aligns with meaningful liquidity or structure.
Educational content only. Not financial advice. No performance guarantees.
Core idea
Extremes matter most at location. Market Extremes identifies when a move is stretched, so you can stop chasing late expansion and wait to see whether price actually rejects or continues accepting higher/lower.
What you get
A smoothed Exhaustion Index (0–100), HTF 3–4 Standard Deviation price walls, plus flow context and optional divergence lines to help judge whether an extreme is weakening or still accepting.
Best combo
Use Market Extremes as extension context, then prioritize Elev8+ Pro triangles as the trigger when an extreme also shows rejection at meaningful structure.
Example 1: Seller exhaustion + rejection wick (NQ • 1m/5m)
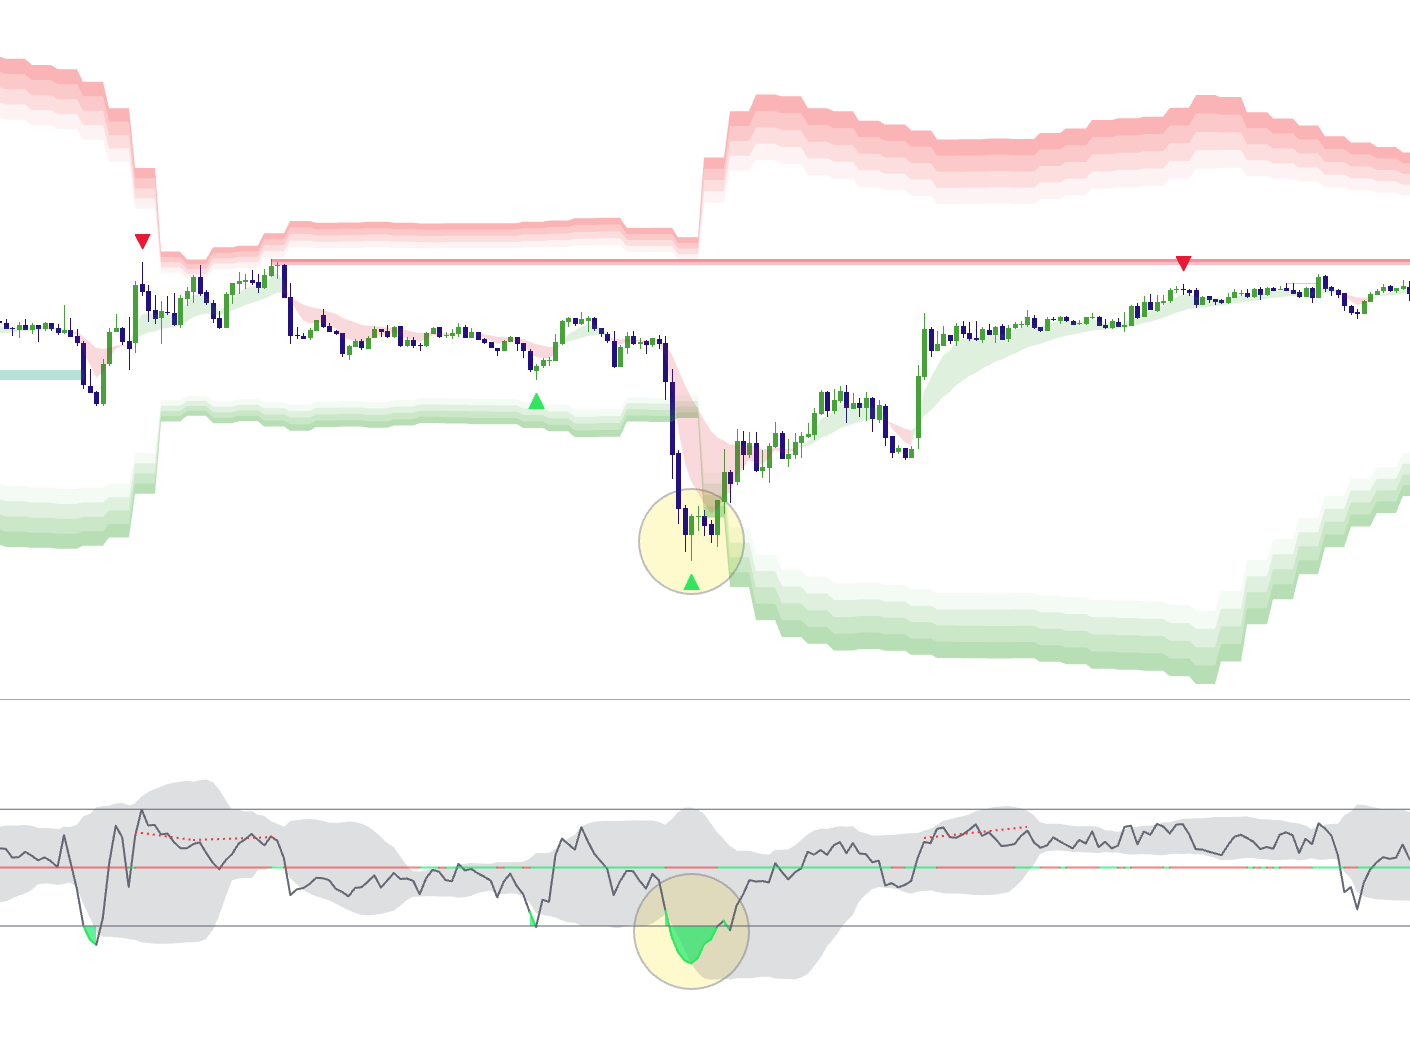
What Is Elev8+ Market Extremes Actually Measuring?
Market Extremes blends three practical inputs into a single “Exhaustion Index” (0–100). It is not meant to be a generic overbought/oversold oscillator—it is designed to organize momentum + pressure + rejection into an exhaustion context:
1) Momentum Base (RSI Core)
A momentum baseline (default 14) acts as the foundation for directional “temperature.” Persistent momentum can keep the index elevated in bullish phases or depressed in bearish phases, which is why an extreme reading alone should never be treated as a reversal.
2) Volume Pressure (Relative to Baseline)
Volume is compared with its baseline (default 20). When volume expands beyond your Exhaustion Threshold, it adds pressure in the direction of the current momentum. At an already extended location, that can help identify a possible climactic push—but strong volume can also support continuation.
3) Wick Rejection (Buyer/Seller Failure)
Large wicks show that price attempted to continue and was rejected from part of the candle range. Upper wick rejection contributes to buyer exhaustion; lower wick rejection contributes to seller exhaustion. The stronger message comes when that rejection occurs at a level that already matters.
How to use it correctly
Treat Market Extremes as a context filter. It highlights when a move is extended enough that chasing becomes less attractive and reversal conditions deserve attention—especially after a liquidity sweep at PDH/PDL, a session high/low, a major swing, or another meaningful level.
How to Read the Exhaustion Index (0–100)
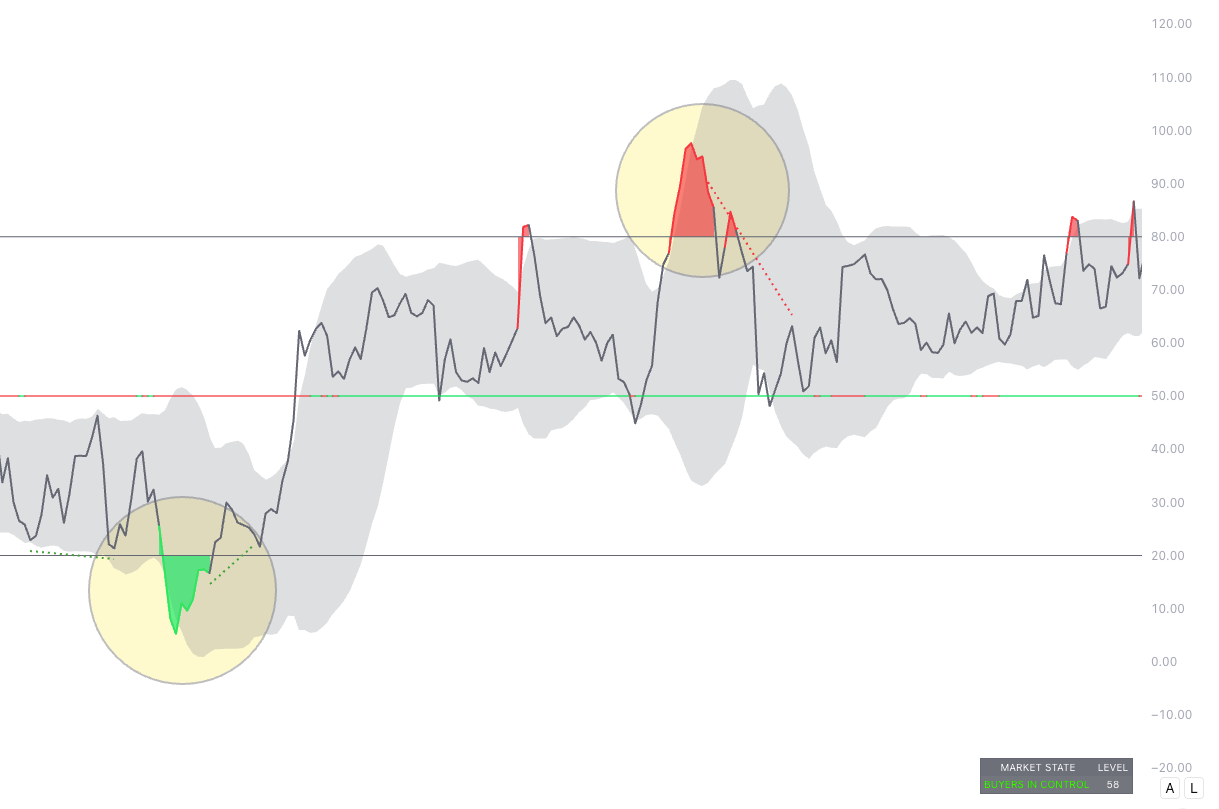
The Exhaustion Index is smoothed and displayed with bands. Read the zones as market state—not automatic entries:
- Above 80 = Buyer Exhaustion (upside stretch; stop chasing and look for evidence that buyers are actually failing)
- Below 20 = Seller Exhaustion (downside stretch; stop chasing and look for evidence that sellers are actually failing)
- Mid-zone = trend/control context (usually less useful for counter-trend reversal timing)
Example 2: Exhaustion Index crossing 80/20 (Oscillator panel)
CMF Midline: Flow Confirmation (helps avoid fading strong pressure)
Inside the oscillator panel you’ll also notice a colored CMF Midline around the 50 level. Use it as a quick “flow check” to judge whether underlying buying/selling pressure still supports the current push or is beginning to disagree with it.
- Green-ish midline = money flow is positive (flow currently favors buyers).
- Red-ish midline = money flow is negative (flow currently favors sellers).
The best way to use it is as a filter, not a standalone signal:
- If you’re in Buyer Exhaustion (> 80) at a premium wall, and the CMF midline is red (or flips red), that adds evidence that the upside push may be losing flow support.
- If you’re in Seller Exhaustion (< 20) at a discount wall, and the CMF midline is green (or flips green), that adds evidence that downside pressure may be losing flow support.
- If CMF stays strongly aligned with the trend (green during highs / red during lows), treat exhaustion as a warning only and wait for clear rejection + your Elev8+ Pro trigger instead of fading momentum simply because the index is extreme.
The Dashboard: Instant Market State
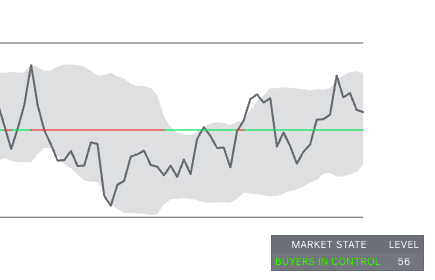
The dashboard summarizes the current “market state” so you can separate directional control from genuine exhaustion at a glance:
- BUYER EXHAUSTION when the index is stretched high
- SELLER EXHAUSTION when the index is stretched low
- BUYERS IN CONTROL or SELLERS IN CONTROL in the trend-control zones
- NEUTRAL in transition
Example 3: Dashboard “Market State” snapshot
HTF “Price Walls”: Where Extremes Tend to React
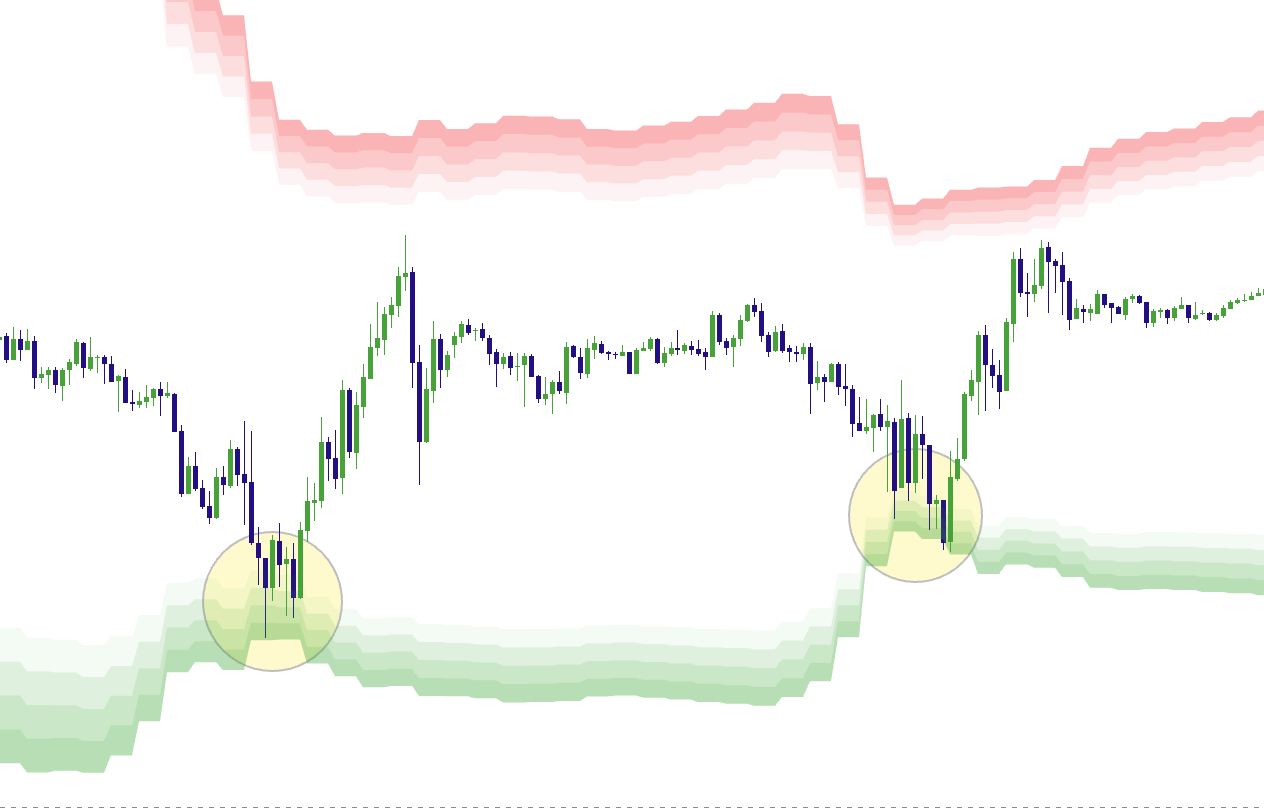
Market Extremes can project higher-timeframe statistical extremes onto your chart using 3.0–4.0 standard deviation zones. These price walls identify statistically extended locations where chasing is increasingly risky and the next reaction becomes more important to evaluate.
- Red gradient zones above = premium statistical extremes (potential resistance / reversal context)
- Green gradient zones below = discount statistical extremes (potential support / reversal context)
Why this matters
A statistical wall tells you price is extended, but the strongest reversal thesis comes when that wall overlaps independent market structure: PDH/PDL, session liquidity, a major swing, VWAP extension, or a validated RB/FVG area.
Example 4: Price tags a 3–4 SD wall zone (Top chart)
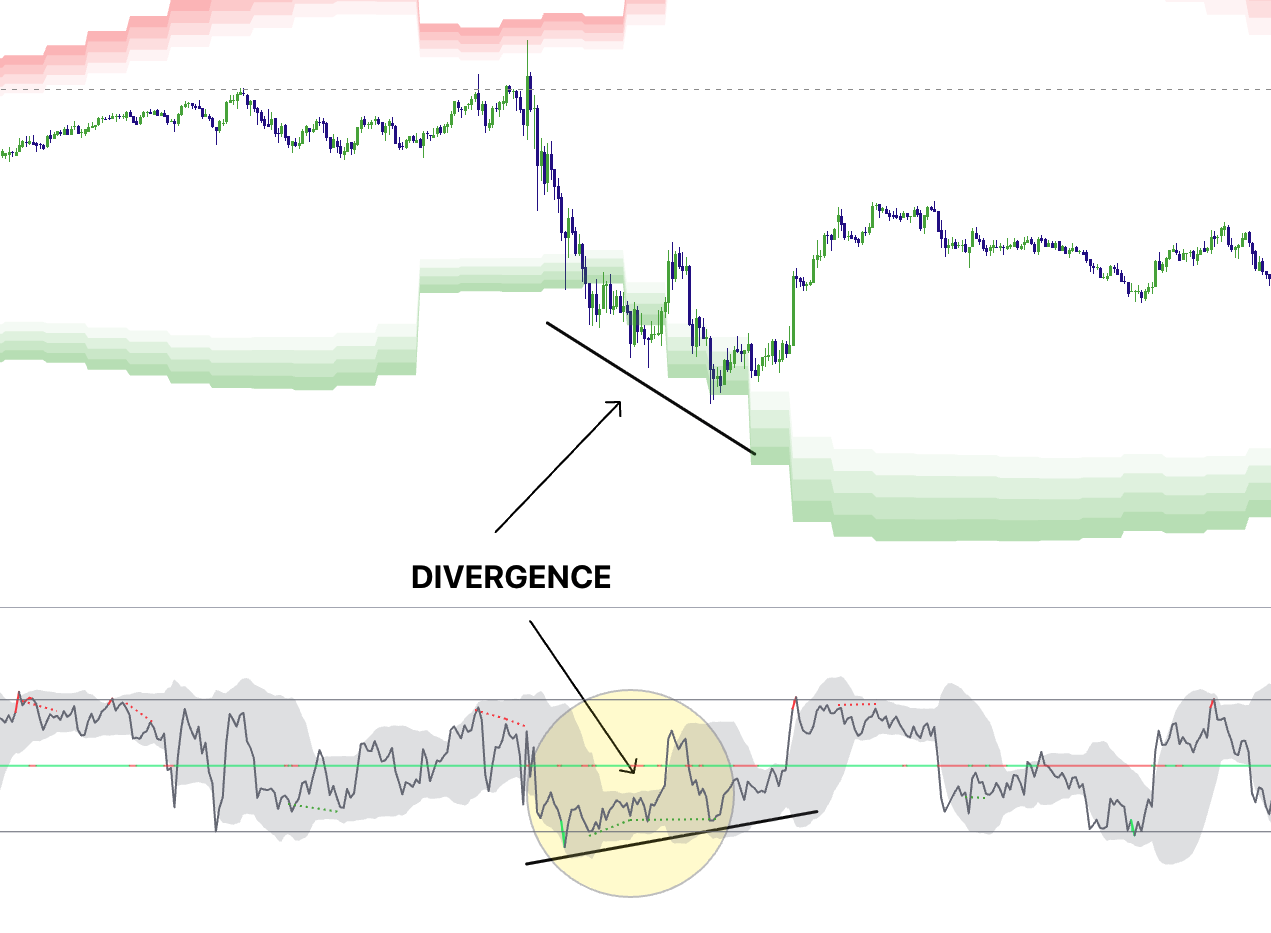
Divergence Lines: When Momentum Disconnects From Price
The divergence module looks for strict pivot-confirmed divergence:
- Bearish divergence: price makes a higher high while momentum makes a lower high
- Bullish divergence: price makes a lower low while momentum makes a higher low
Divergence is not required, but it becomes much more useful when it prints at a wall during exhaustion and agrees with a real liquidity or structural event.
Example 5: Divergence at an extreme zone
The Best Way to Trade It: Context First, Trigger Second
Market Extremes is not a “buy/sell button.” It tells you when price is statistically and behaviorally stretched enough that chasing becomes less attractive. The reversal thesis still needs meaningful location, rejection or failure, and an Elev8+ Pro reversal triangle for execution.
The rule
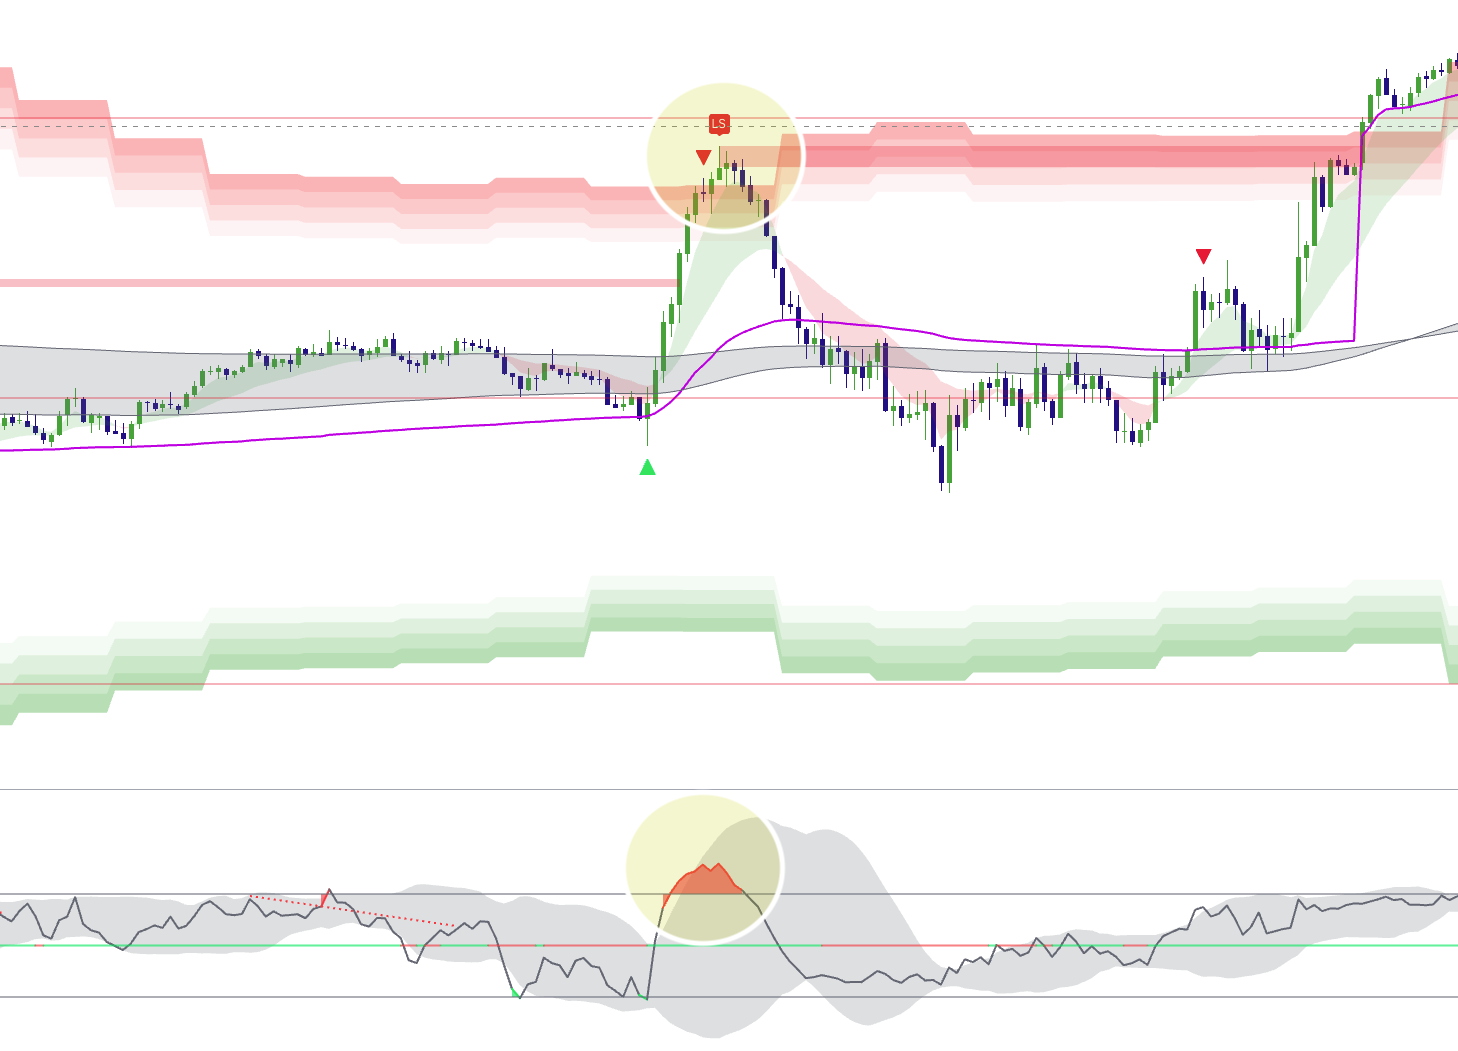
Market Extremes = extension + exhaustion context. Elev8+ Pro = trigger. Prioritize signals when walls + exhaustion align with independent structure and price actually rejects the extreme.
Two Higher-Confluence Reversal Playbooks
1) Bearish Reversal at Premium (Buyer Exhaustion)
- Location: price tags the red wall zone (3SD+ premium), ideally near external liquidity or resistance
- Condition: Exhaustion Index pushes above 80 and the upside move is visibly stretched
- Bonus: PDH/session high/major swing sweep, divergence, VWAP extension, or 1h/4h resistance aligns
- Trigger: price rejects/fails to accept higher and an Elev8+ Pro reversal triangle prints near the wall
- Invalidation: beyond the structure that defined the extreme high / failed reversal thesis
Example 6: Full bearish confluence (Walls + Exhaustion + Pro trigger)
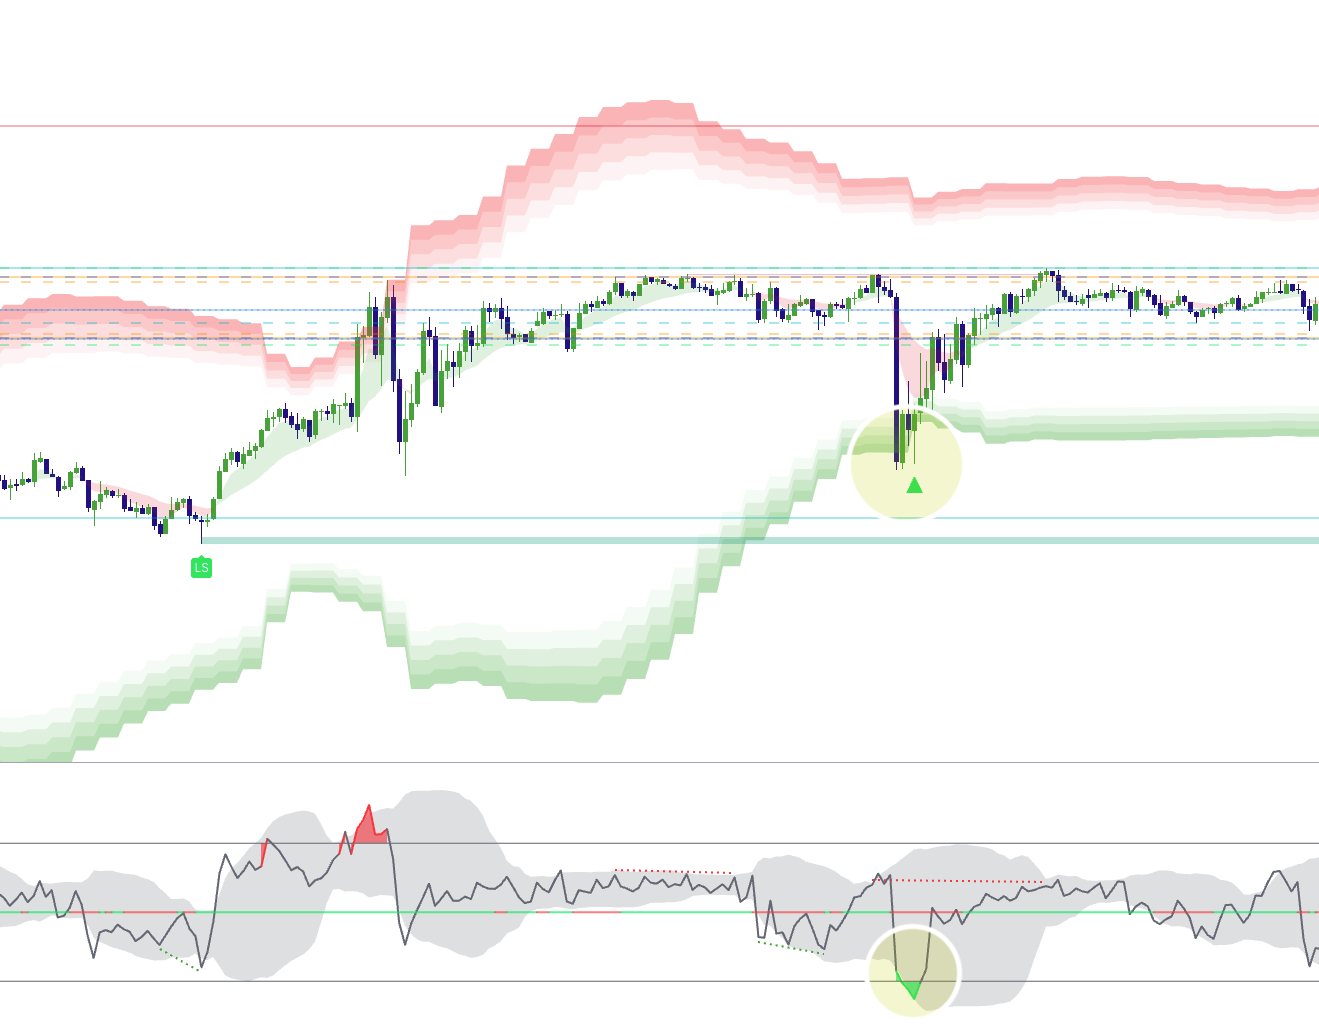
2) Bullish Reversal at Discount (Seller Exhaustion)
- Location: price tags the green wall zone (3SD+ discount), ideally near external liquidity or support
- Condition: Exhaustion Index drops below 20 and the downside move is visibly stretched
- Bonus: PDL/session low/major swing sweep, divergence, VWAP extension, or HTF support aligns
- Trigger: price rejects/fails to accept higher and an Elev8+ Pro reversal triangle prints near the wall
- Invalidation: beyond the structure that defined the extreme low / failed reversal thesis
Example 7: Full bullish confluence (Walls + Exhaustion + Pro trigger)
Extremes Checklist (use this before entering)
• Price is at/inside a 3SD+ wall zone and preferably near meaningful liquidity/structure.
• Exhaustion Index is above 80 (bear) or below 20 (bull), showing genuine stretch.
• You see rejection, reclaim, failed continuation, or other evidence the extreme is not being accepted.
• Pro triangle prints near the extreme after the reversal thesis has context behind it.
• Invalidation is clear beyond the structure that would prove the reversal thesis wrong.
• You are not fading repeated closes, strong displacement, or a successful retest outside the wall.
Example: Price pushes into a Market Extremes Sell Zone after reaching an extended location, then rejects and prints a triangle sell signal. The invalidation belongs beyond the structure that would prove the rejection failed, while VWAP or prior session structure can become logical mean-reversion targets.
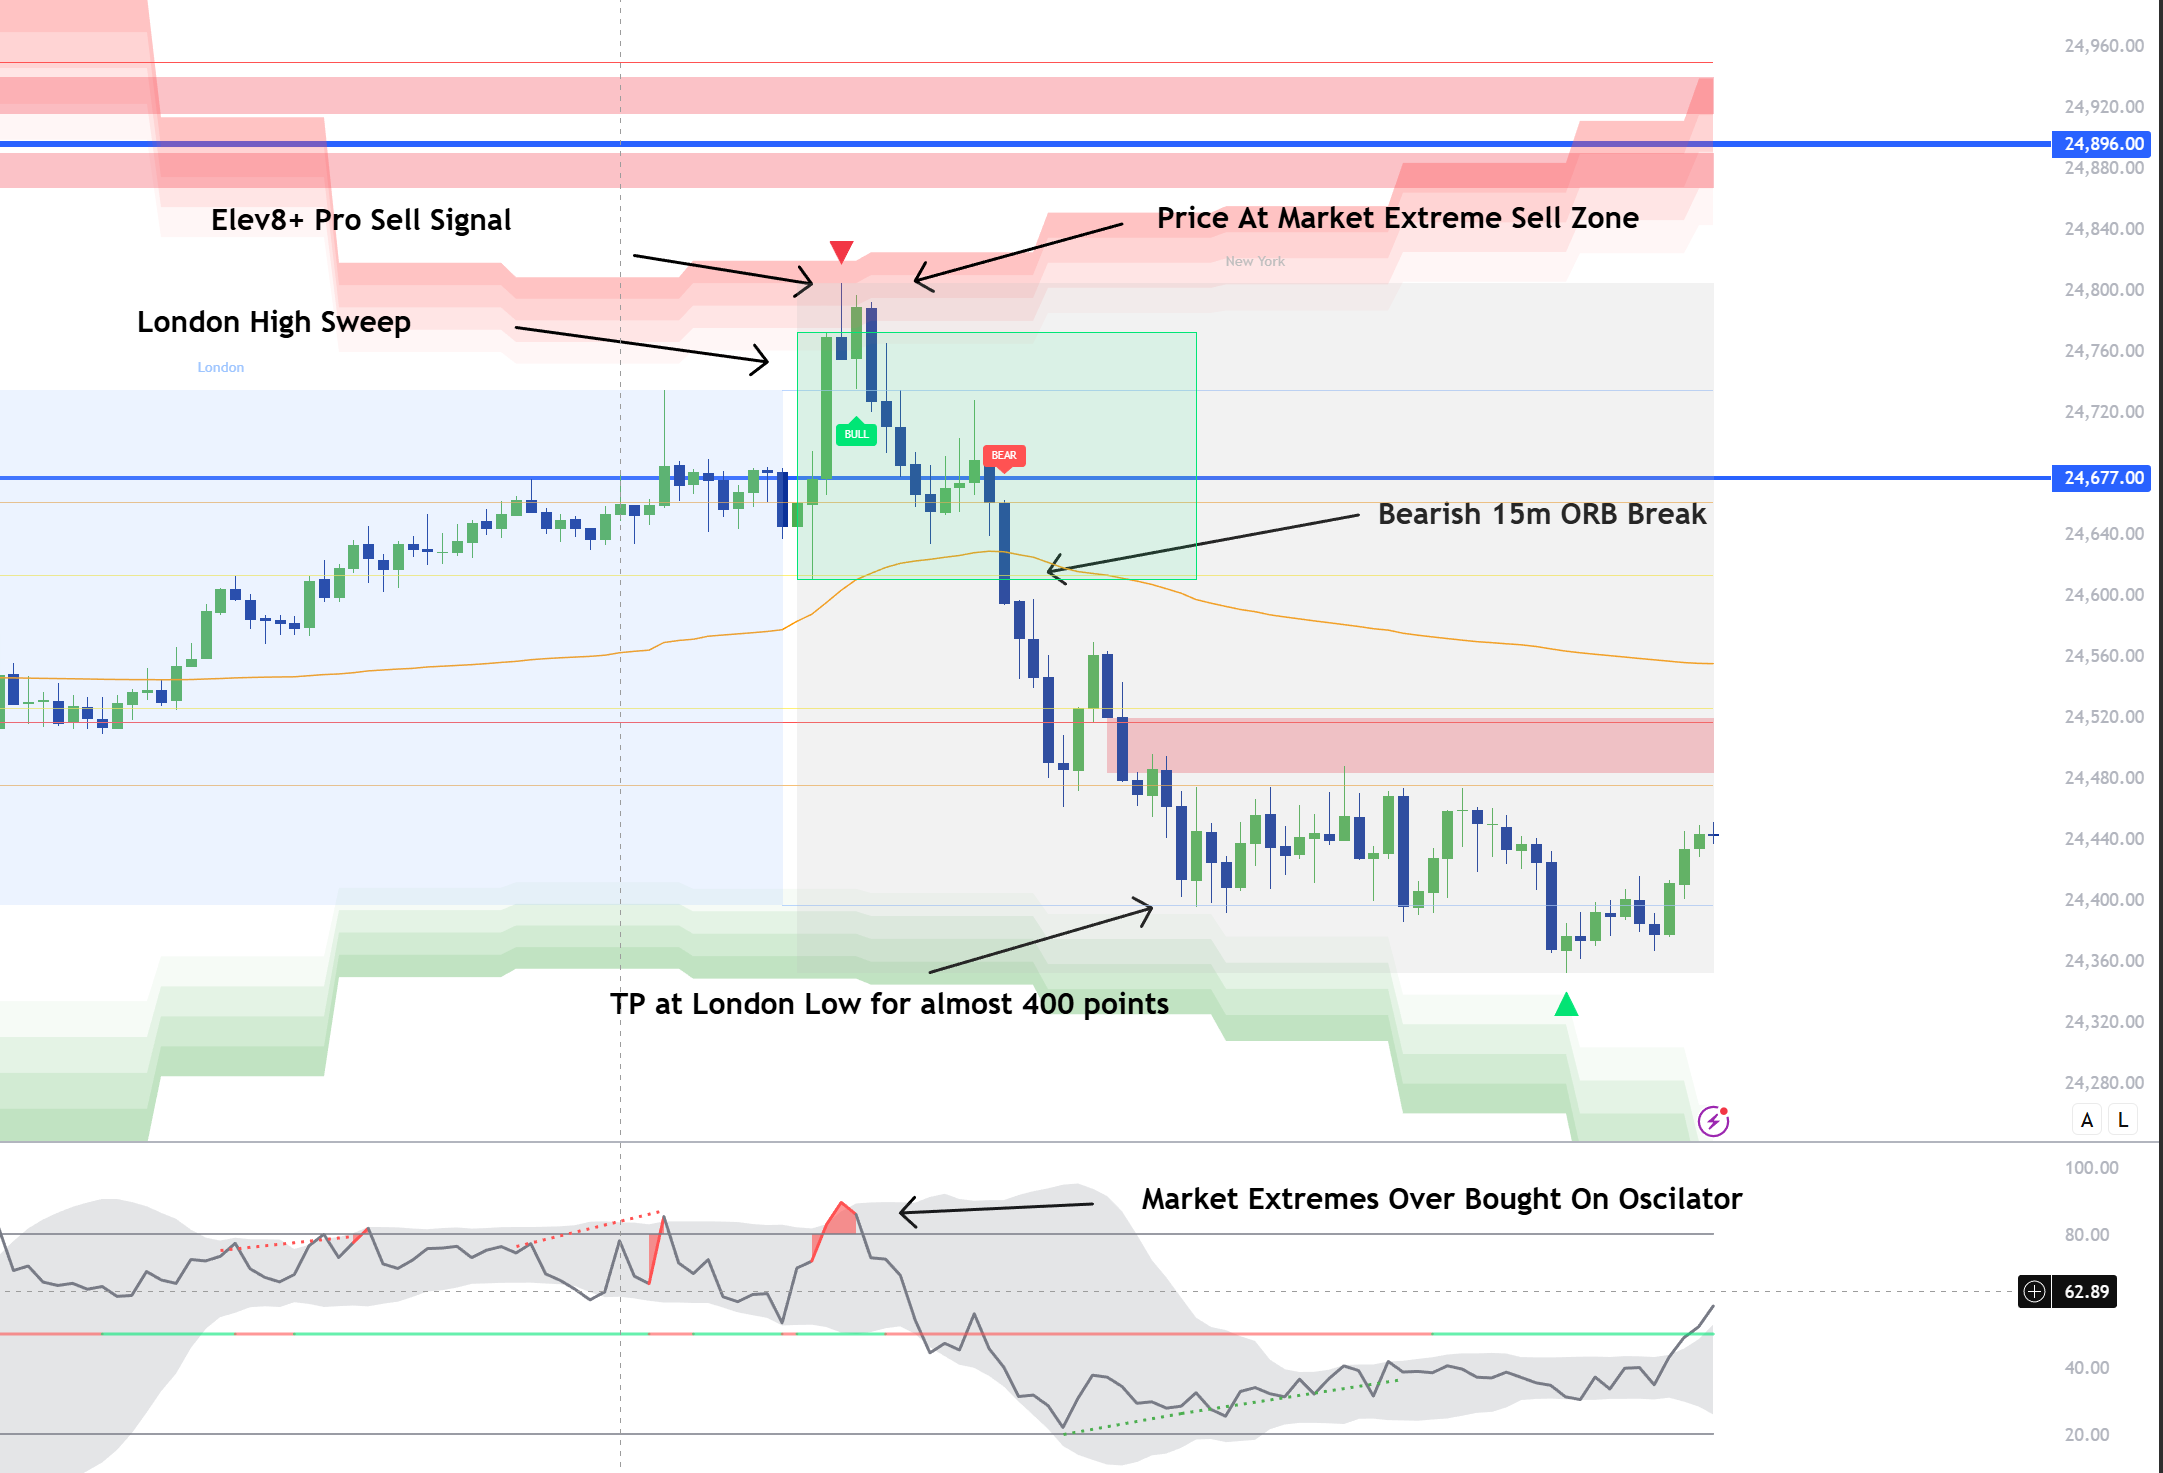
If you cannot define invalidation, you do not have an extremes trade—only a guess.
How to Avoid the Biggest Mistake: Fighting Real Continuation
Exhaustion does not guarantee a reversal. Strong markets can remain statistically stretched while price continues building acceptance. Use these warning signs to avoid fading a move simply because the oscillator or wall says “extreme”:
- Multiple closes holding outside the wall edge instead of immediately rejecting back inside
- Pullbacks that successfully hold the wall as new support/resistance after the breakout
- Expansion continues in the same direction with strong closes and no meaningful failure/reclaim
Decision Tree (simple)
Step 1: Are we at a 3-4SD+ wall zone and/or meaningful external liquidity?
Step 2: Is the Exhaustion Index extreme (above 80 / below 20) and is the move visibly stretched?
Step 3: Does price reject/reclaim the area, or is it continuing to accept beyond it?
If YES: wait for a Pro triangle, confirm the reversal structure, and define invalidation. (check multiple timeframes)
If NO: treat the extreme as a warning only—do not fight continued acceptance.
Suggested Settings (Start Here)
The default settings provide a clean baseline; adjust selectivity only after you understand how the index behaves on your market and timeframe:
- Momentum Base: 14
- Volume Baseline: 20
- Exhaustion Threshold: 1.5 (raise for fewer “extreme” readings)
- Pivot Lookback: 5 / 5 (raise for fewer divergence prints)
- Show Price Walls: On
- Show Dashboard: On
Common Mistakes (and the Fix)
- Mistake: Treating 80/20 as an auto-entry. Fix: require meaningful location, rejection/failure, then the Pro trigger.
- Mistake: Taking Pro triangles mid-range. Fix: prioritize signals where extremes overlap real liquidity or structure.
- Mistake: Placing stops arbitrarily close or far. Fix: invalidation belongs beyond the structure that proves the thesis wrong.
- Mistake: Ignoring acceptance. Fix: repeated closes + successful retests beyond the wall favor continuation over an early fade.
Want to see Market Extremes in action?
Use Market Extremes to identify statistically stretched areas and exhaustion, then combine those readings with meaningful liquidity, rejection, and Elev8+ Pro reversal triangles for execution. The objective is not to call every top or bottom—it is to stop chasing late moves and focus on reversals that have location, confirmation, and defined invalidation.
Indicators and examples are for education only. Always define risk and trade only what fits your plan.
Quick Checklist
- I can recognize buyer and seller exhaustion and divergence conditions.
- I can interpret higher-timeframe extension zones without automatically fading them.
- I can combine regime and extreme context with qualified price confirmation.
What Invalidates the Setup?
Stand aside when meaningful location, the expected price response, confirmation, clearly defined structural risk, or a realistic target is missing. A tool or signal by itself does not complete the trade thesis.
Common Mistakes
- Using every available tool on every setup.
- Treating a plotted level, zone, alert, or label as an entry by itself.
Next Recommended Lesson
Elev8+ Momentum Gaps: Impulse Zones, FVGs, and Confluence for Cleaner Reversal Setups →