
What You'll Learn
- Locate session ranges, ORB structure, PDH/PDL, and mapped liquidity.
- Interpret the daily bias dashboard as context rather than a blind signal.
- Use Market Map to decide where a trade thesis could matter.
Market Structure • Sessions + ORB + Daily Bias
Elev8+ Market Map: Know Where the Important Decisions Are Before Price Gets There
Most intraday traders do not need more entry signals—they need better locations. Elev8+ Market Map organizes the trading day around the levels where liquidity, breakouts, failed breakouts, and important session decisions are most likely to occur. It maps Asia, London, New York and Globex structure, session highs and lows, PDH/PDL, opening ranges, Overnight VWAP, optional Session Fib Lines, and a locked New York open context snapshot.
The goal is not to predict every move. The goal is to know where price is making an important decision, then determine whether that level is being swept and rejected or broken and accepted. From there, Reversal Blocks, Real FVGs, Market Extremes, VWAP Deviation, divergence, rejection, or Elev8+ reversal signals can help refine the actual entry.
Educational content only. Not financial advice. No performance guarantees.
Core idea
Trade from meaningful structure, not random mid-range candles. Market Map shows where session liquidity, prior-day levels, and opening ranges can create the next important decision.
What you get
Session boxes + session H/L liquidity lines, PDH/PDL, Pre-Market + NY ORBs, optional Session Fib Lines, Overnight VWAP, and daily Context + ORB dashboards.
Best combo
Use Market Map to determine where the trade matters, then use structure such as a Reversal Block or Real FVG plus rejection, divergence, exhaustion, or an Elev8+ trigger to decide when to execute.
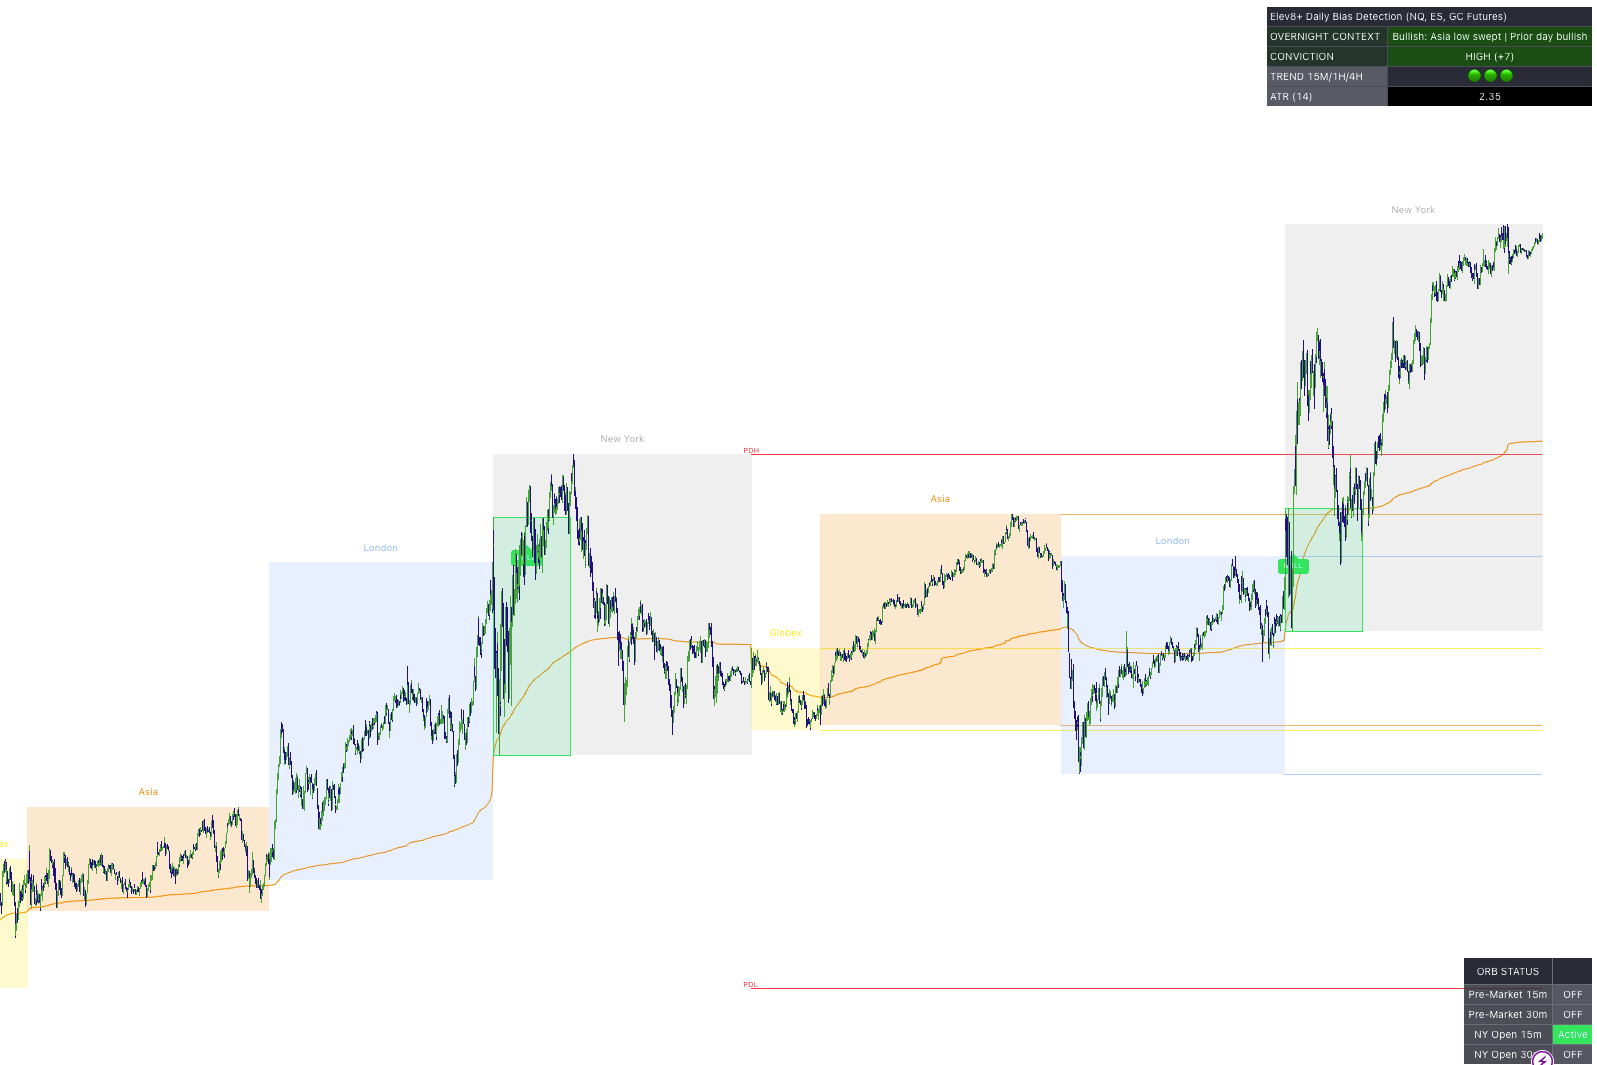
Image 1: Full Market Map overlay (NQ/ES • 1m or 5m)
What Is Elev8+ Market Map?
Elev8+ Market Map is the location and market-context layer of the Elev8 framework. It identifies where liquidity has accumulated, where prior ranges end, where opening ranges are established, and where the market must decide between rejection and acceptance.
It is intentionally not a buy/sell indicator. Instead, it helps you:
- avoid taking trades in random mid-range locations,
- identify meaningful liquidity and breakout/retest areas before price reaches them,
- separate sweep + reversal behavior from break + continuation behavior.
The correct mindset
Market Map = location + context. RB / Real FVG = precision structure. Rejection / divergence / exhaustion / Elev8+ signal = timing. If you cannot explain both why here? and what would prove me wrong?, the setup probably is not ready.
Step 1: Session Boxes + Session High/Low Liquidity Lines
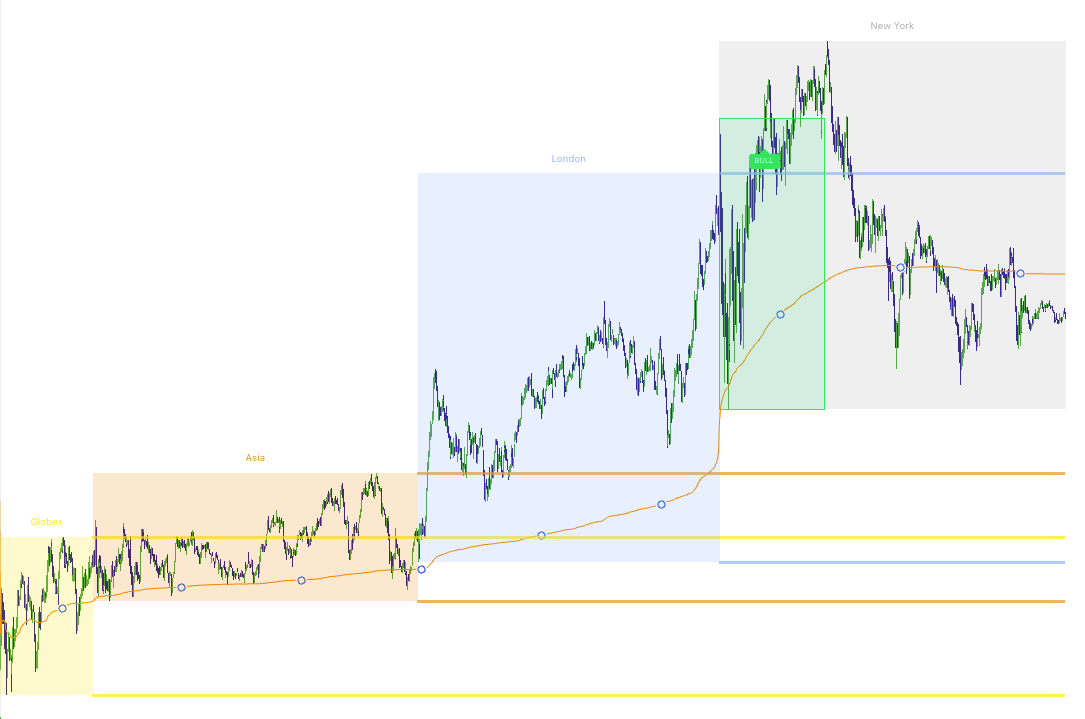
The first layer of Market Map divides the trading day into its major sessions: Globex, Asia, London and New York. Each session builds its own high and low, and those levels can remain extended after the session is complete.
These highs and lows matter because they are obvious reference points where traders often place stops, breakout orders, and resting liquidity. When price eventually returns, watch for one of three behaviors:
- sweep + reject — price briefly runs the level and fails back through it,
- break + accept — price closes beyond the level and continues holding outside,
- retest — the old high/low becomes support or resistance after the break.
Image 2: Asia + London session boxes with extended H/L lines
How to trade session highs/lows (two playbooks)
A) Sweep + Reclaim (reversal play)
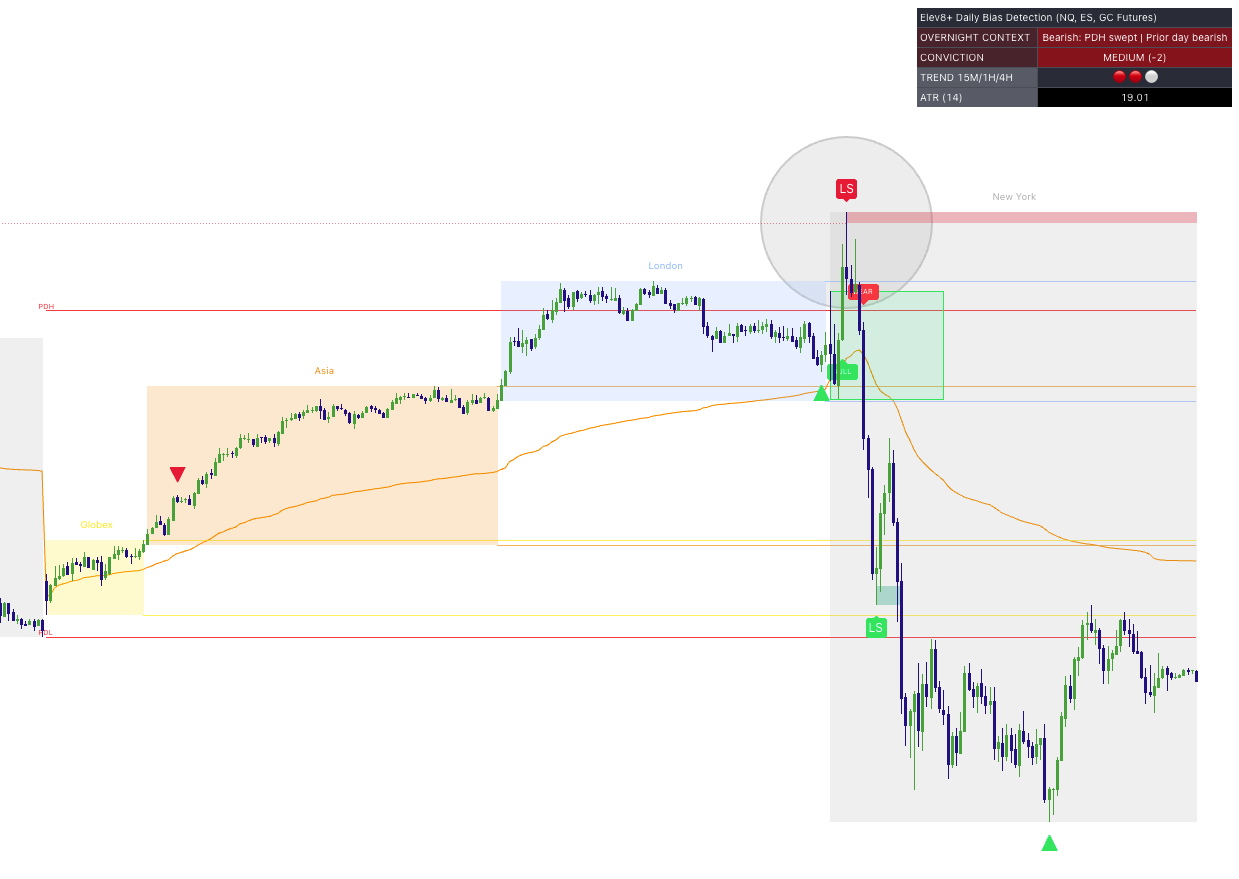
A sweep occurs when price trades through a session high or low, takes the liquidity sitting beyond it, but then cannot maintain acceptance outside the prior range. The best reversals usually require more than the sweep itself—the market should begin showing failure, rejection or displacement back in the opposite direction.
- Bearish sweep idea: run above a session high → fail/reclaim below → look for bearish rejection, exhaustion/divergence, a bearish Reversal Block, or an Elev8+ sell trigger.
- Bullish sweep idea: run below a session low → reclaim above → look for bullish rejection, exhaustion/divergence, a bullish Reversal Block, or an Elev8+ buy trigger.
B) Break + Hold (breakout continuation play)
If price breaks a session high or low and continues closing outside the range without meaningful rejection, the market is showing acceptance. Do not keep fading the level simply because it was previously resistance or support. Instead, watch for a corrective retest of the old level—especially when the breakout creates a Real FVG or Reversal Block that overlaps the retest.
- Breakout long idea: break above session high → accept above → corrective pullback → hold old high / Real FVG → continue.
- Breakout short idea: break below session low → accept below → corrective rally → hold old low / Real FVG → continue.
Confirmation integration
For a reversal, let the sweep finish first. A signal that appears after price reclaims the level is much more useful than trying to predict the reversal while price is still expanding through liquidity. For continuation, look for the opposite: clean acceptance followed by a controlled retest.
Image 3: Session sweep + Pro triangle trigger
Step 2: PDH/PDL — The Daily Line in the Sand
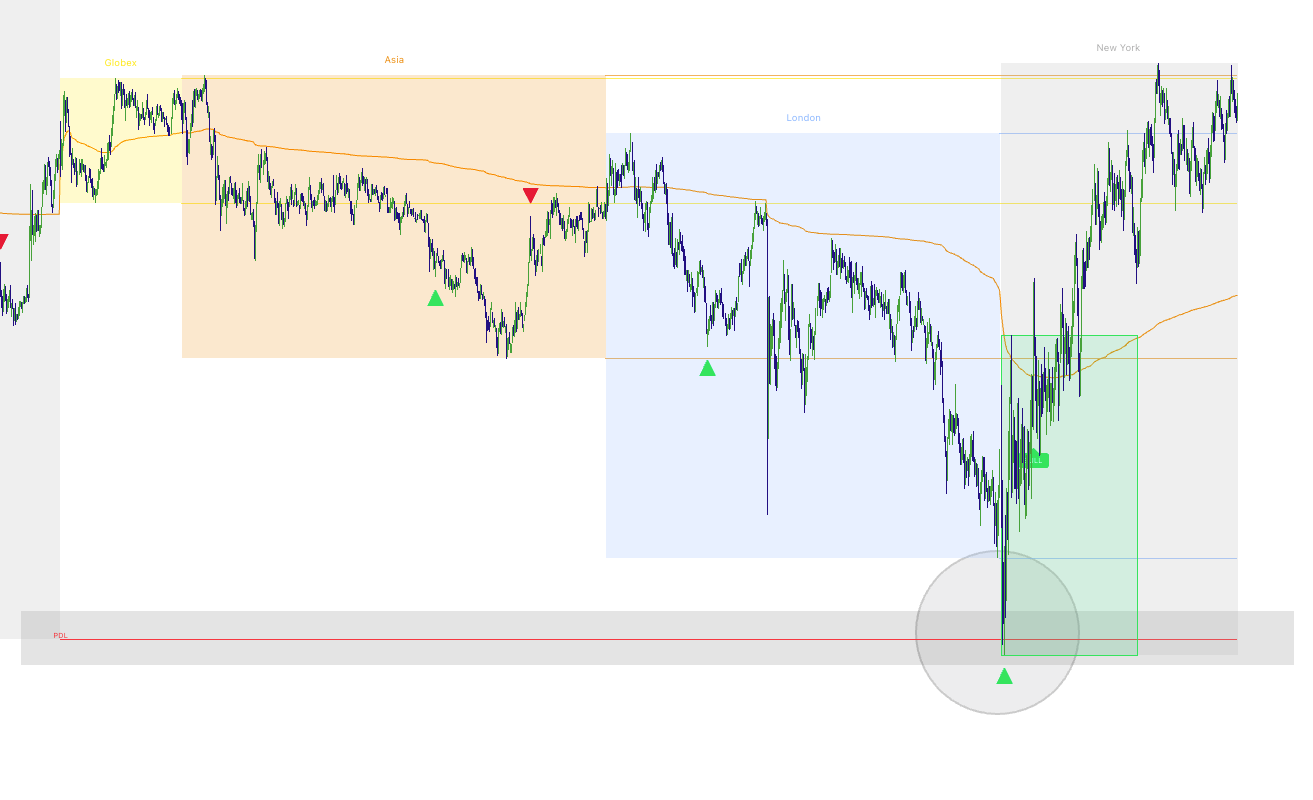
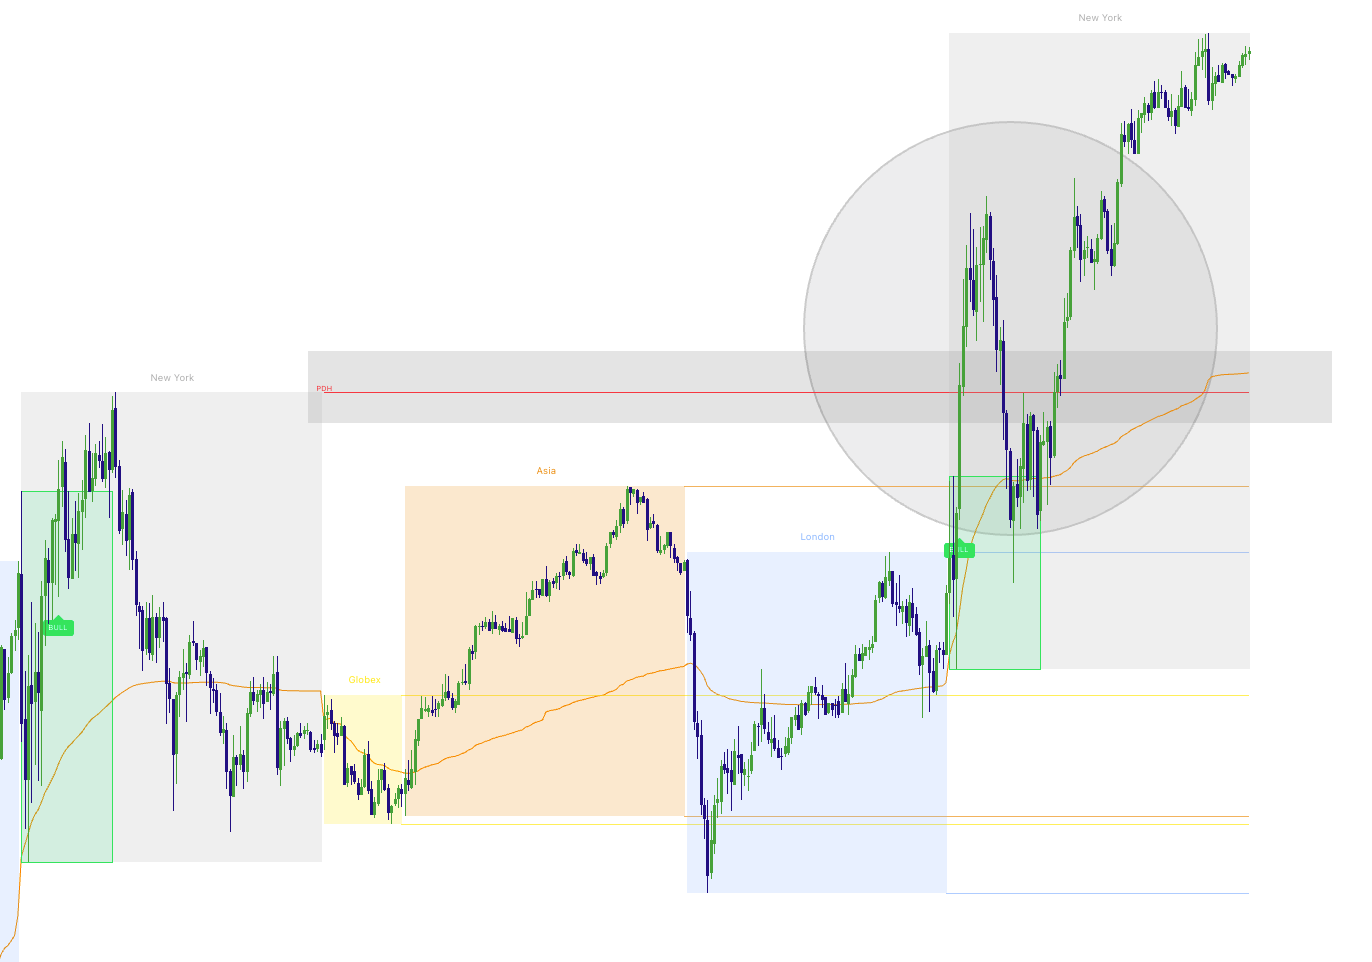
Market Map plots PDH (Prior Day High) and PDL (Prior Day Low) and extends them forward. These are among the most important daily liquidity references because price approaching them can lead to two completely different outcomes: a sweep back into the prior range or acceptance outside the prior range.
Image 4: PDH/PDL plotted with a clean reaction
PDH/PDL strategies (simple and effective)
1) PDH/PDL Sweep + Fail (trap reversal)
This is classic external-liquidity behavior. Price trades above PDH or below PDL, triggers stops and breakout orders, but then fails to maintain the move. The highest-quality setups occur when the liquidity sweep is joined by another independent reason for price to reverse: VWAP 2–3 SD extension, Market Extremes exhaustion/divergence, a Reversal Block, or strong rejection back through the level.
- Bearish trap: sweep PDH → reject/reclaim below PDH → confirm failure → look for a structured short back toward the range.
- Bullish trap: sweep PDL → reject/reclaim above PDL → confirm failure → look for a structured long back toward the range.
2) PDH/PDL Break + Acceptance (trend day behavior)
Sometimes PDH/PDL does not reject at all. Price breaks the level with displacement and continues holding outside the prior day's range. That behavior should shift your thinking from reversal to continuation.
- Acceptance above PDH: bullish context; prioritize corrective pullbacks that hold above PDH, especially into a bullish Real FVG or RB.
- Acceptance below PDL: bearish context; prioritize corrective rallies that hold below PDL, especially into a bearish Real FVG or RB.
Image 5: PDH/PDL sweep vs acceptance comparison
Step 3: ORB Pro — Opening Range Breakouts (Pre-Market + NY Open)
The ORB Pro module defines the market's opening ranges so you can see where early-session balance ends and directional expansion begins. ORB highs and lows often become important short-term support/resistance because they mark the boundaries traders are watching during the most active part of the session.
Market Map currently includes four ORB windows you can enable:
- Pre-Market 15m and Pre-Market 30m
- NY Open 15m and NY Open 30m
Each ORB can optionally plot:
- 50% midline to help visualize where price is trading inside the opening range,
- Projected 1x and 2x range levels above and below the ORB as structured expansion references.
Image 6: ORB boxes (NY 15m + optional midline + TP levels)
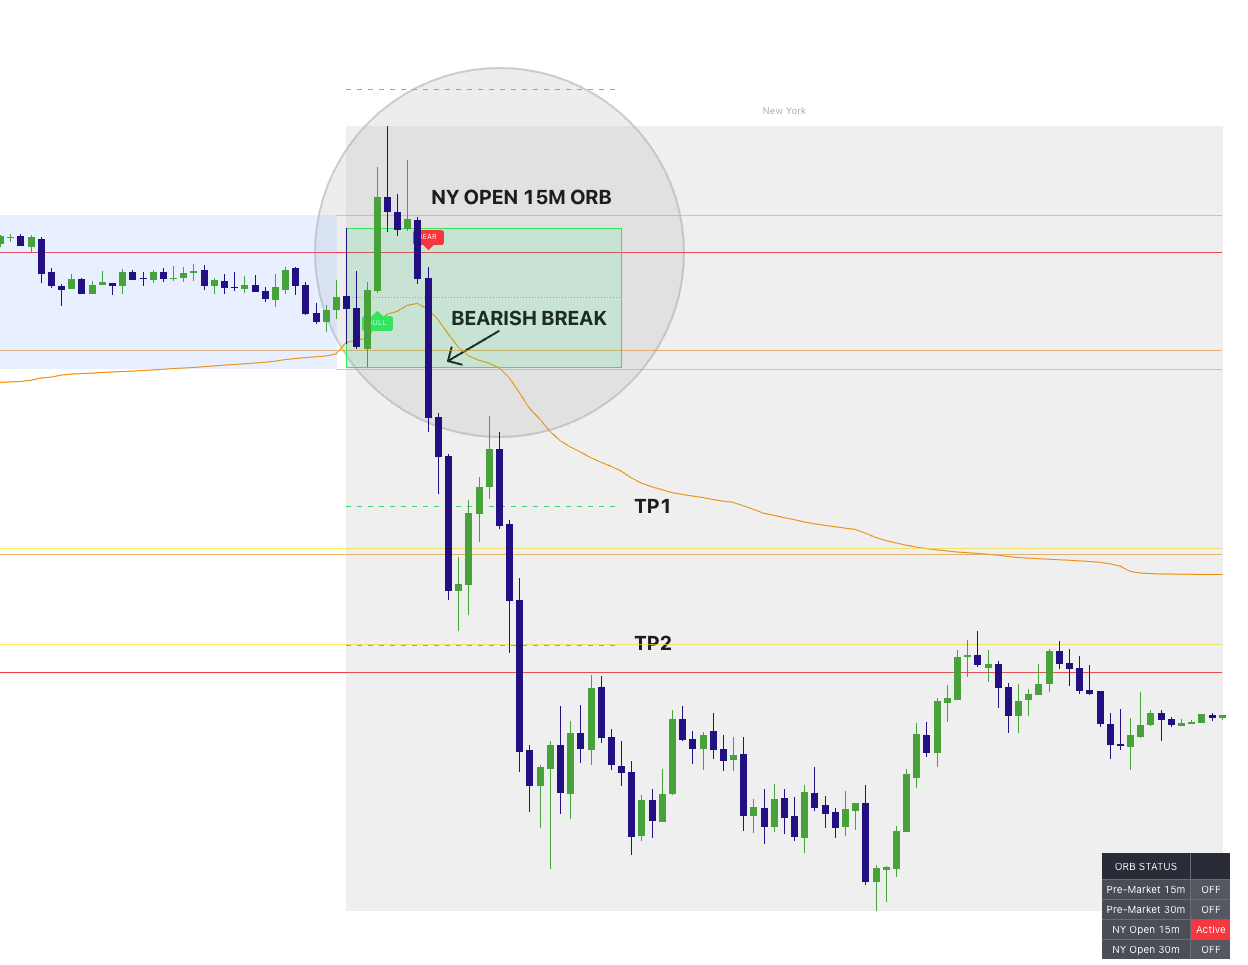
ORB breakout strategy (the clean playbook)
The goal is not to predict the breakout before it happens. Let the opening range form, then require price to prove that it can trade and close beyond one side.
- Step 1: Let the ORB complete.
- Step 2: Wait for a close outside the range and evaluate whether price is showing acceptance.
- Step 3: Prefer a corrective retest of the ORB boundary, especially if a Real FVG or RB overlaps the area.
- Step 4: Use the ORB boundary for structure and the 1x/2x projections or next liquidity level as possible targets.
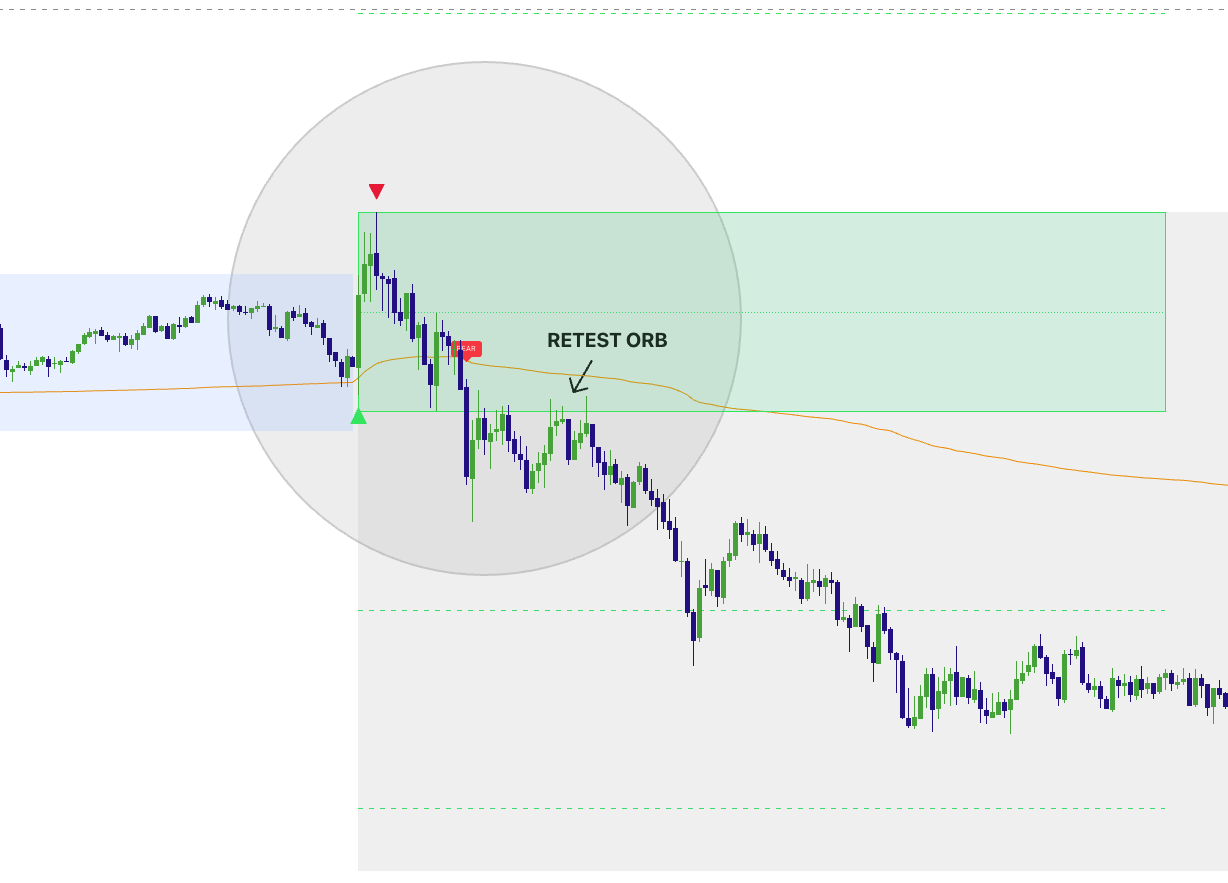
ORB continuation (break + retest)
One of the cleanest ORB trades occurs after the breakout rather than during it:
- Bullish: close above ORB high → accept above → corrective pullback → hold ORB/FVG → continue higher.
- Bearish: close below ORB low → accept below → corrective rally → hold ORB/FVG → continue lower.
ORB failed breakout (trap + reversal)
If price breaks outside the ORB but cannot remain there and quickly returns inside, the breakout may have functioned as a liquidity grab instead of true expansion. Now the setup shifts from continuation to a possible reversal back through the range.
- Bull trap: break above ORB high → fail/reclaim below → confirm rejection → look back into the range.
- Bear trap: break below ORB low → reclaim above → confirm rejection → look back into the range.
Image 7: ORB break + retest entry (with Pro triangle)
ORB Alerts (so you don’t miss the break)
Market Map includes breakout alerts for all four ORB configurations. The alert is triggered when price closes beyond the completed ORB high or low, allowing you to monitor the important event without watching every candle.
Alert setup
In TradingView, create an alert on Market Map and choose the breakout condition you want: Pre-Market 15m bull/bear, Pre-Market 30m bull/bear, NY 15m bull/bear, or NY 30m bull/bear. An alert tells you that price has broken the range—it does not replace evaluating whether the breakout is being accepted or rejected.
Step 4: Session Fib Lines — Intraday Support/Resistance Map
Session Fib Lines are an optional structure layer built from a locked 05:00–09:00 ET session range. Once that window is complete, Market Map calculates its high, low and midpoint, then projects evenly spaced levels above and below the midpoint using 0.236 × the completed session range as the step size.
- minor lines provide repeating intraday reaction references,
- major levels highlight approximately 1.0-range expansion areas,
- extension levels highlight areas near approximately 1.618R and 2.618R expansion.
These lines are calculated from 1-minute data and remain locked once the session range is complete. Treat them as reaction and target references, not automatic reversal signals.
Image 8: Session Fib Lines acting as intraday reaction levels
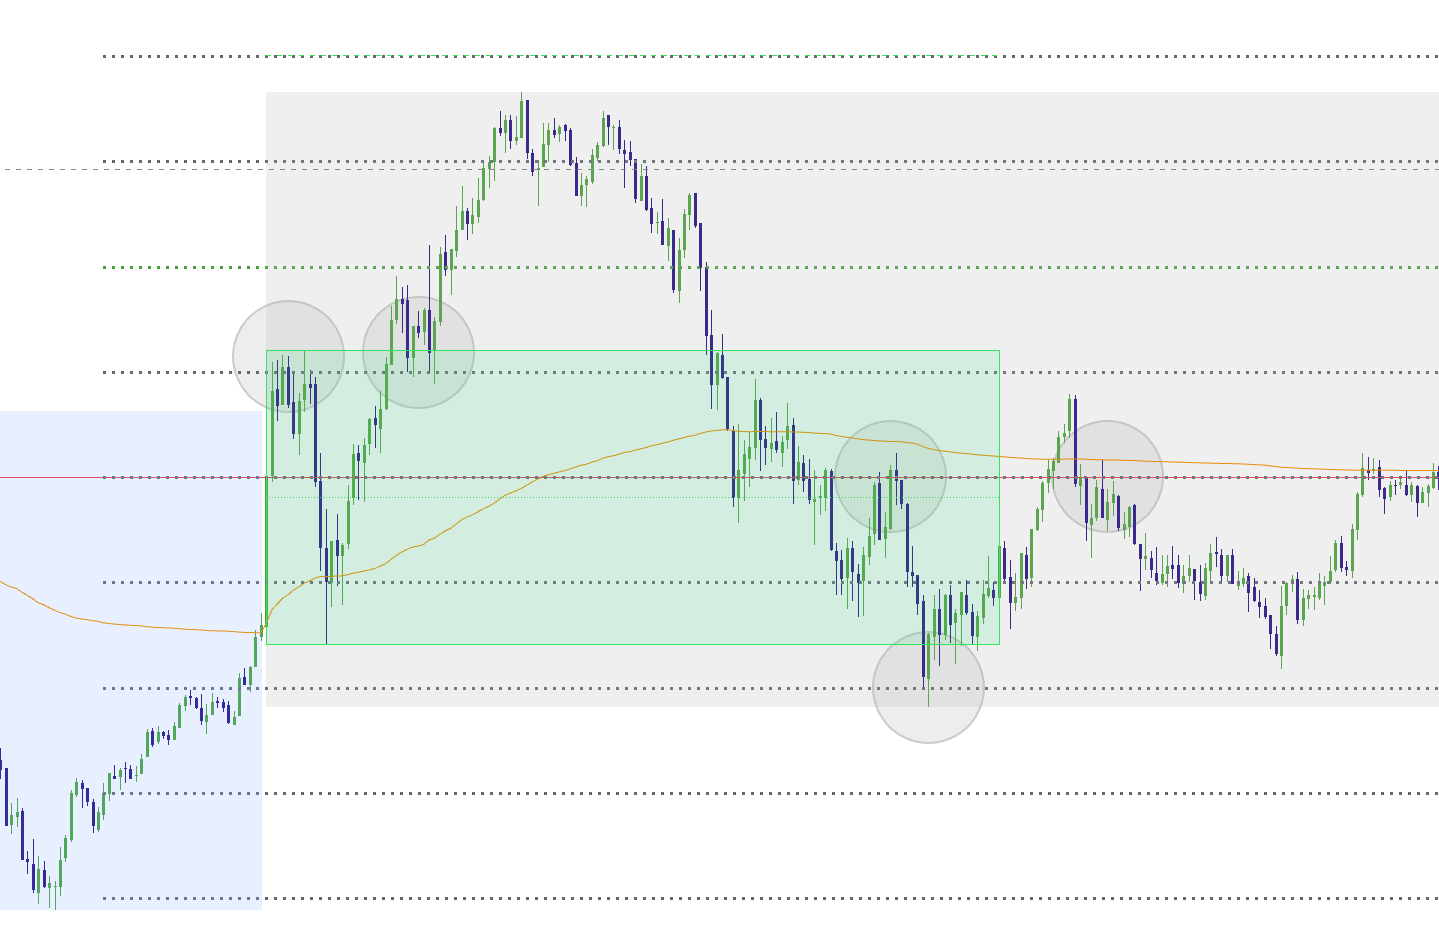
How to trade fib lines (two clean approaches)
A) Reaction + confirmation (reversal)
- Price reaches a Session Fib Line at an already stretched or meaningful location.
- Price stalls, sweeps, or shows clear wick rejection.
- Divergence, exhaustion, an RB, or an Elev8+ reversal signal confirms the reaction.
- Invalidation is defined beyond the structure that made the reaction thesis valid.
B) Hold + continuation (trend support/resistance)
- Price breaks a fib line with strong closes and directional displacement.
- The pullback retests the old line as support/resistance.
- If the retest remains corrective and holds, continuation can resume toward the next projected level.
Important
Session Fib Lines are structure—not signals. They become much more useful when the same area also contains session liquidity, PDH/PDL, a Reversal Block, Real FVG, VWAP extension, exhaustion, or another independent reason for price to react.
Step 5: The Context Dashboard — Your Daily NY Open Bias Snapshot
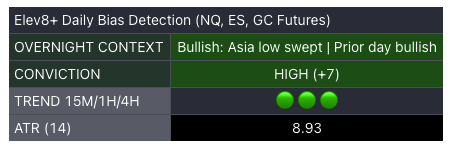
Market Map's Daily Bias Context Dashboard summarizes the overnight setup into one locked snapshot. The calculation uses a 1-minute snapshot ending at 09:30 ET, then keeps that context locked for the trading day so the bias does not constantly change after the session is already underway.
- Overnight Context: bullish, bearish, or neutral narrative plus the strongest reasons behind the reading.
- Conviction: LOW / MEDIUM / HIGH based on the magnitude of the context score.
- Trend alignment: quick 15m / 1H / 4H directional references.
- ATR(14): current volatility context to help calibrate expectations.
Image 9: Daily Bias Context Dashboard at NY open
How to use the daily bias correctly
The dashboard is not saying enter long or enter short. It is telling you what conditions existed going into New York and which side may deserve more attention. The scoring considers factors such as higher-timeframe trend, prior-day behavior, Overnight VWAP, PDH/PDL sweeps or acceptance, Asia/London structure and overnight extension.
- High conviction: prioritize setups aligned with the bias, but never let the dashboard override a clear NY liquidity sweep, rejection, or structural reversal.
- Low conviction: expect less directional clarity; sweeps, rotations and mean-reversion setups may deserve more attention.
- Neutral: do not force a prediction—let NY establish the next directional event first.
Putting It All Together: Three High-Probability Playbooks
Playbook 1: ORB Breakout Day (structure-based trend)
- Context: Daily dashboard and HTF structure support the breakout direction.
- Proof: ORB breaks with displacement and price maintains acceptance outside the range.
- Entry idea: corrective retest of the ORB boundary, preferably overlapping a Real FVG or Reversal Block.
- Targets: 1x/2x ORB projections and the next external session or daily liquidity level.
Playbook 2: PDH/PDL Trap Day (sweep + reversal)
- Context: price sweeps PDH/PDL and fails back inside the prior day's range.
- Confluence: VWAP deviation, Market Extremes exhaustion/divergence, or a Reversal Block strengthens the reversal location.
- Trigger: rejection/reclaim plus an Elev8+ reversal signal or other confirmation.
- Targets: internal range structure, VWAP, session midpoint, or opposite-side liquidity depending on the strength of the rotation.
Playbook 3: Session Liquidity Reaction Day (London/Asia levels)
- Context: Asia or London high/low becomes the next major intraday liquidity objective.
- Reversal: sweep + reclaim + rejection → look for rotation away from the level.
- Continuation: break + acceptance + Real FVG/RB retest → look for continuation through the level.
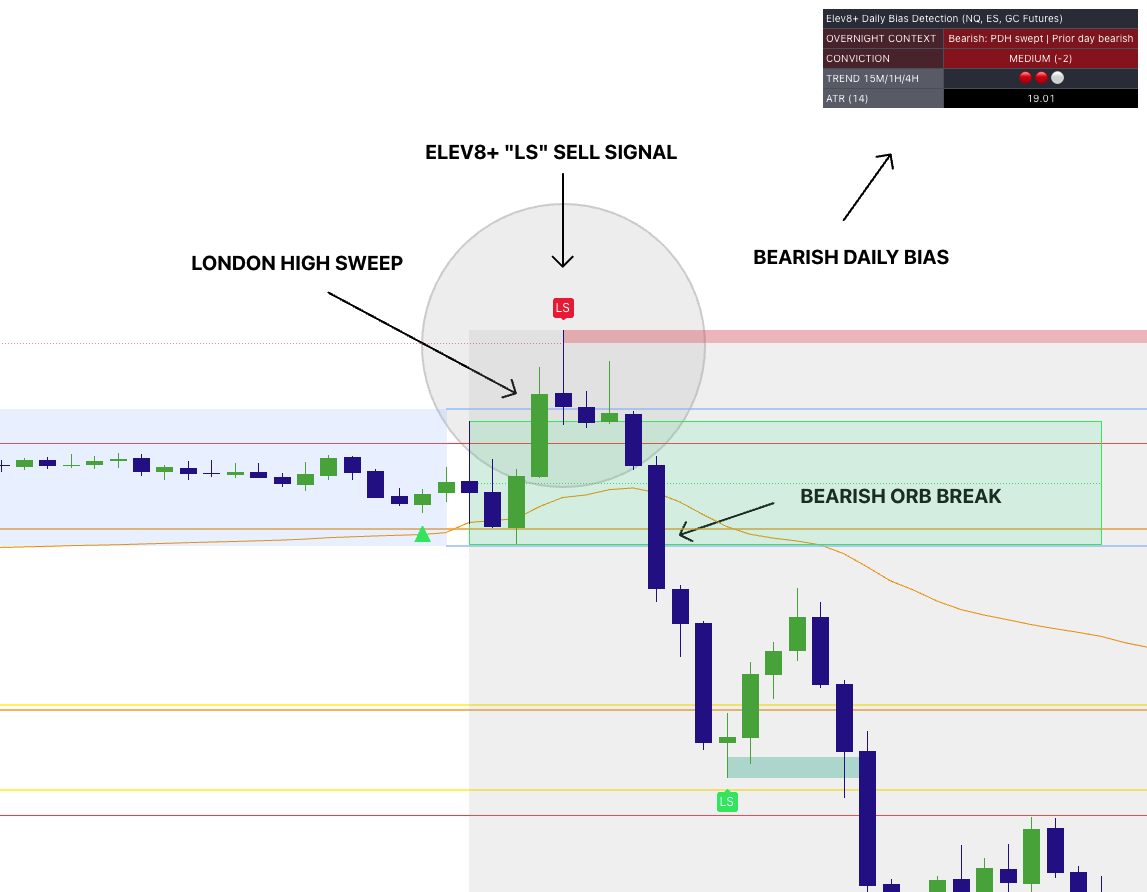
Image 10: Full confluence example (sessions + PDH/PDL + ORB + Pro)
Suggested Settings (Start Here)
Market Map contains several optional layers, so the cleanest approach is to start with the pieces that define the day's main structure:
- Sessions: Globex + Asia + London + New York ON
- Extend Session High/Low Lines: ON
- PDH/PDL: ON
- ORB: NY Open 15m ON; add NY 30m or Pre-Market ORBs only if they are part of your playbook
- ORB Labels: ON (Bull/Bear)
- Session Fib Lines: OFF initially; add them once you are comfortable reading the base liquidity map
- Dashboards: ON (Daily Bias Context + ORB Status)
Common mistakes (and the fix)
• Mistake: Trading in the middle with no structural reason. Fix: prioritize mapped liquidity, ORB boundaries, RBs or Real FVG retests.
• Mistake: Fading strong acceptance. Fix: if price breaks, holds and retests successfully, shift from reversal thinking to continuation.
• Mistake: Taking every signal at every location. Fix: use signals as confirmation after the market reaches an area that already matters.
• Mistake: Turning on every feature immediately. Fix: start with sessions + liquidity lines + PDH/PDL + NY15 ORB, then add layers only when they improve a specific playbook.
If you cannot define why price should react here, what behavior confirms the trade, and where the idea is invalidated, you do not yet have a complete Market Map setup.
Trade the level, the reaction, and the story—not random candles
Use Elev8+ Market Map to organize the day around session liquidity, PDH/PDL, ORB structure, Overnight VWAP and Session Fib reactions. Then combine those locations with Reversal Blocks, Real FVGs, VWAP Deviation, Market Extremes, divergence, rejection and Elev8+ confirmation signals to build trades with a clear reason, trigger and invalidation.
Indicators and examples are for education only. Always define risk and trade only what fits your plan.
Quick Checklist
- I can locate session ranges, ORB structure, PDH/PDL, and mapped liquidity.
- I can interpret the daily bias dashboard as context rather than a blind signal.
- I can use Market Map to decide where a trade thesis could matter.
What Invalidates the Setup?
Stand aside when meaningful location, the expected price response, confirmation, clearly defined structural risk, or a realistic target is missing. A tool or signal by itself does not complete the trade thesis.
Common Mistakes
- Using every available tool on every setup.
- Treating a plotted level, zone, alert, or label as an entry by itself.