Who This Is For
- NQ traders building a preparation routine before the open.
- Traders learning to connect price levels with written entry rules.
- Anyone reviewing trades against a consistent checklist.
NY Open Setup
The U.S. stock-market open can bring fast moves through overnight highs and lows. Use a written checklist to assess a sweep before considering an entry.
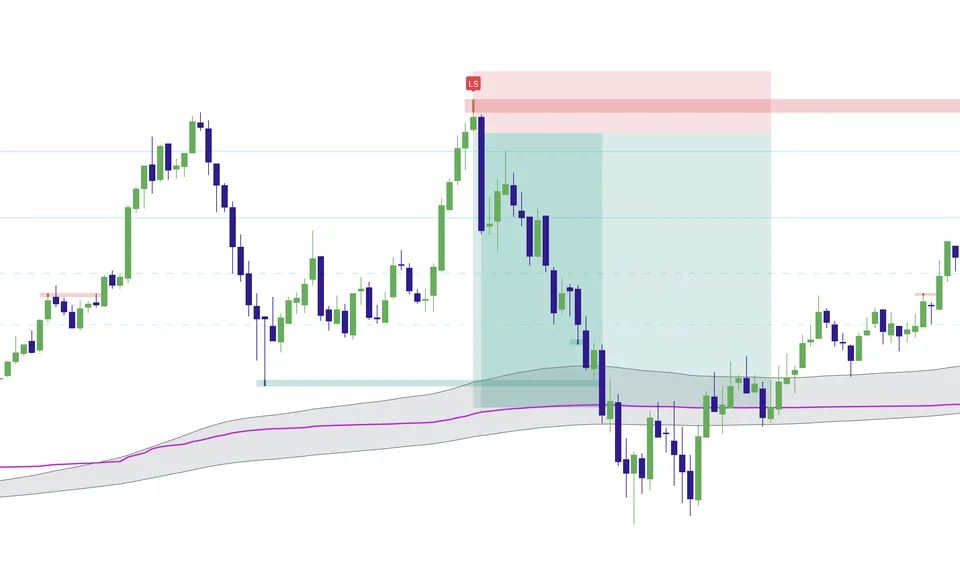
Liquidity sweep chart showing reclaim and invalidation levels.
What You Will Learn
The opening move can cross levels in both directions. Observe the reaction at a planned level before deciding whether your entry conditions are present.
Work through these checks in order. The examples explain a process; they are not instructions to place a trade.
Mark the overnight high, low, and midpoint before the U.S. cash open so you know which levels you are watching.
Observe which levels the first move reaches and whether price stays beyond them or returns inside the range.
Compare the reaction with your entry rules. A fast move is not a reason to skip the risk check.
Failed hold above ONH transitions into short rotation setup.
Recovery above ONL shifts setup toward value.
Use Market Health levels and context before the bell so your opening trades are tied to a plan, not reaction speed.
Want to see analysis on your chart? Watch the Elev8+ indicator walkthrough to compare the separate TradingView subscription.
Published by Elev8+ Trading to explain trading concepts and our products. Elev8 sells the tools linked here; these guides are not independent product rankings or personalized financial advice. Chart examples illustrate a process, not audited trading results.
Dates identify substantive content updates, not a claim of independent expert review. Check current exchange, broker, and prop-firm rules before relying on a calculation. Ask a question or report a correction.
Next Step
Use Market Health for session preparation and the free email course to learn how to read levels, signals, and potential exits.
Daily levels and context from Market Health
Free lessons on chart analysis and risk