Who This Is For
- NQ traders building a preparation routine before the open.
- Traders learning to connect price levels with written entry rules.
- Anyone reviewing trades against a consistent checklist.
Premarket Bias
A premarket bias is a working view of market direction, not a forecast. Define what would support that view and what would make you change it.
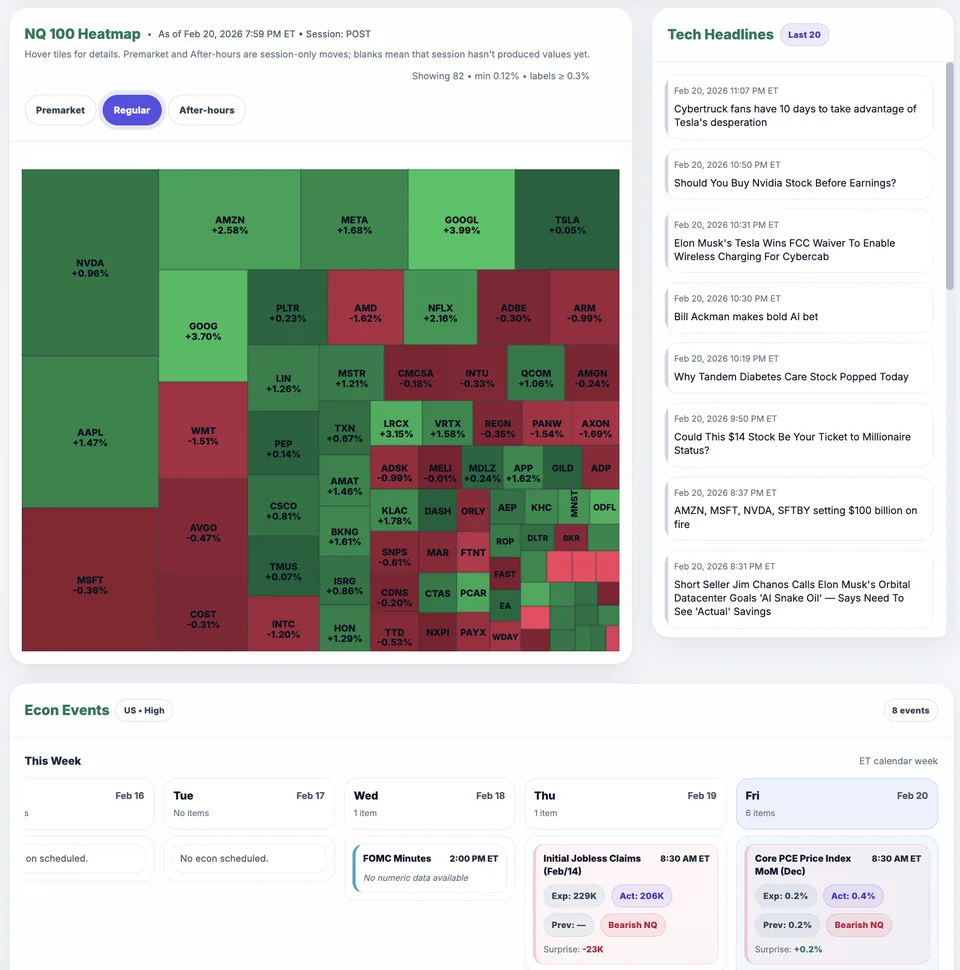
Nasdaq heatmap panel showing breadth and leadership pressure.
What You Will Learn
A useful premarket plan is conditional. It states what the market is doing, which locations matter, and what evidence would change your view. A directional label alone leaves too much room to rationalize a trade after the fact. The routine below uses Market Health for context and your chart for the actual price sequence; neither replaces your entry and risk rules.
Work through these checks in order. The examples explain a process; they are not instructions to place a trade.
Check the timestamp and session label before reading a dashboard. A post-market screenshot is not a live premarket feed. If a panel is stale or unavailable, note the missing information and avoid treating the last displayed value as current.
Review how many tracked stocks are advancing and declining, then compare the leaders and larger index components. A few heavily weighted names can move the index while many other stocks disagree. These are different observations, not votes you can simply add together.
Mark the relevant prior-day and overnight highs and lows. Compare the current price with those references and the opening context. The cash-market summary and futures chart have different roles and trading sessions; a bearish summary does not independently identify a short entry.
Describe what price holding beyond a level would mean, what a failed break and return would mean, and what would leave you without an acceptable trade. Include the invalidation condition and your own risk limit. Revisit the plan when new evidence arrives rather than defending the initial label.
Suppose declining stocks outnumber advancing stocks, but NQ has already fallen into a support area you marked. Selling solely because the dashboard says bearish ignores location. Wait for your planned sequence or skip; a correct broad view can still produce a poorly timed entry.
Imagine your premarket idea expected rejection at a prior high, but price holds above it after the open. Record that the rejection condition did not occur. You can remain flat and reassess without immediately reversing direction or inventing a new setup.
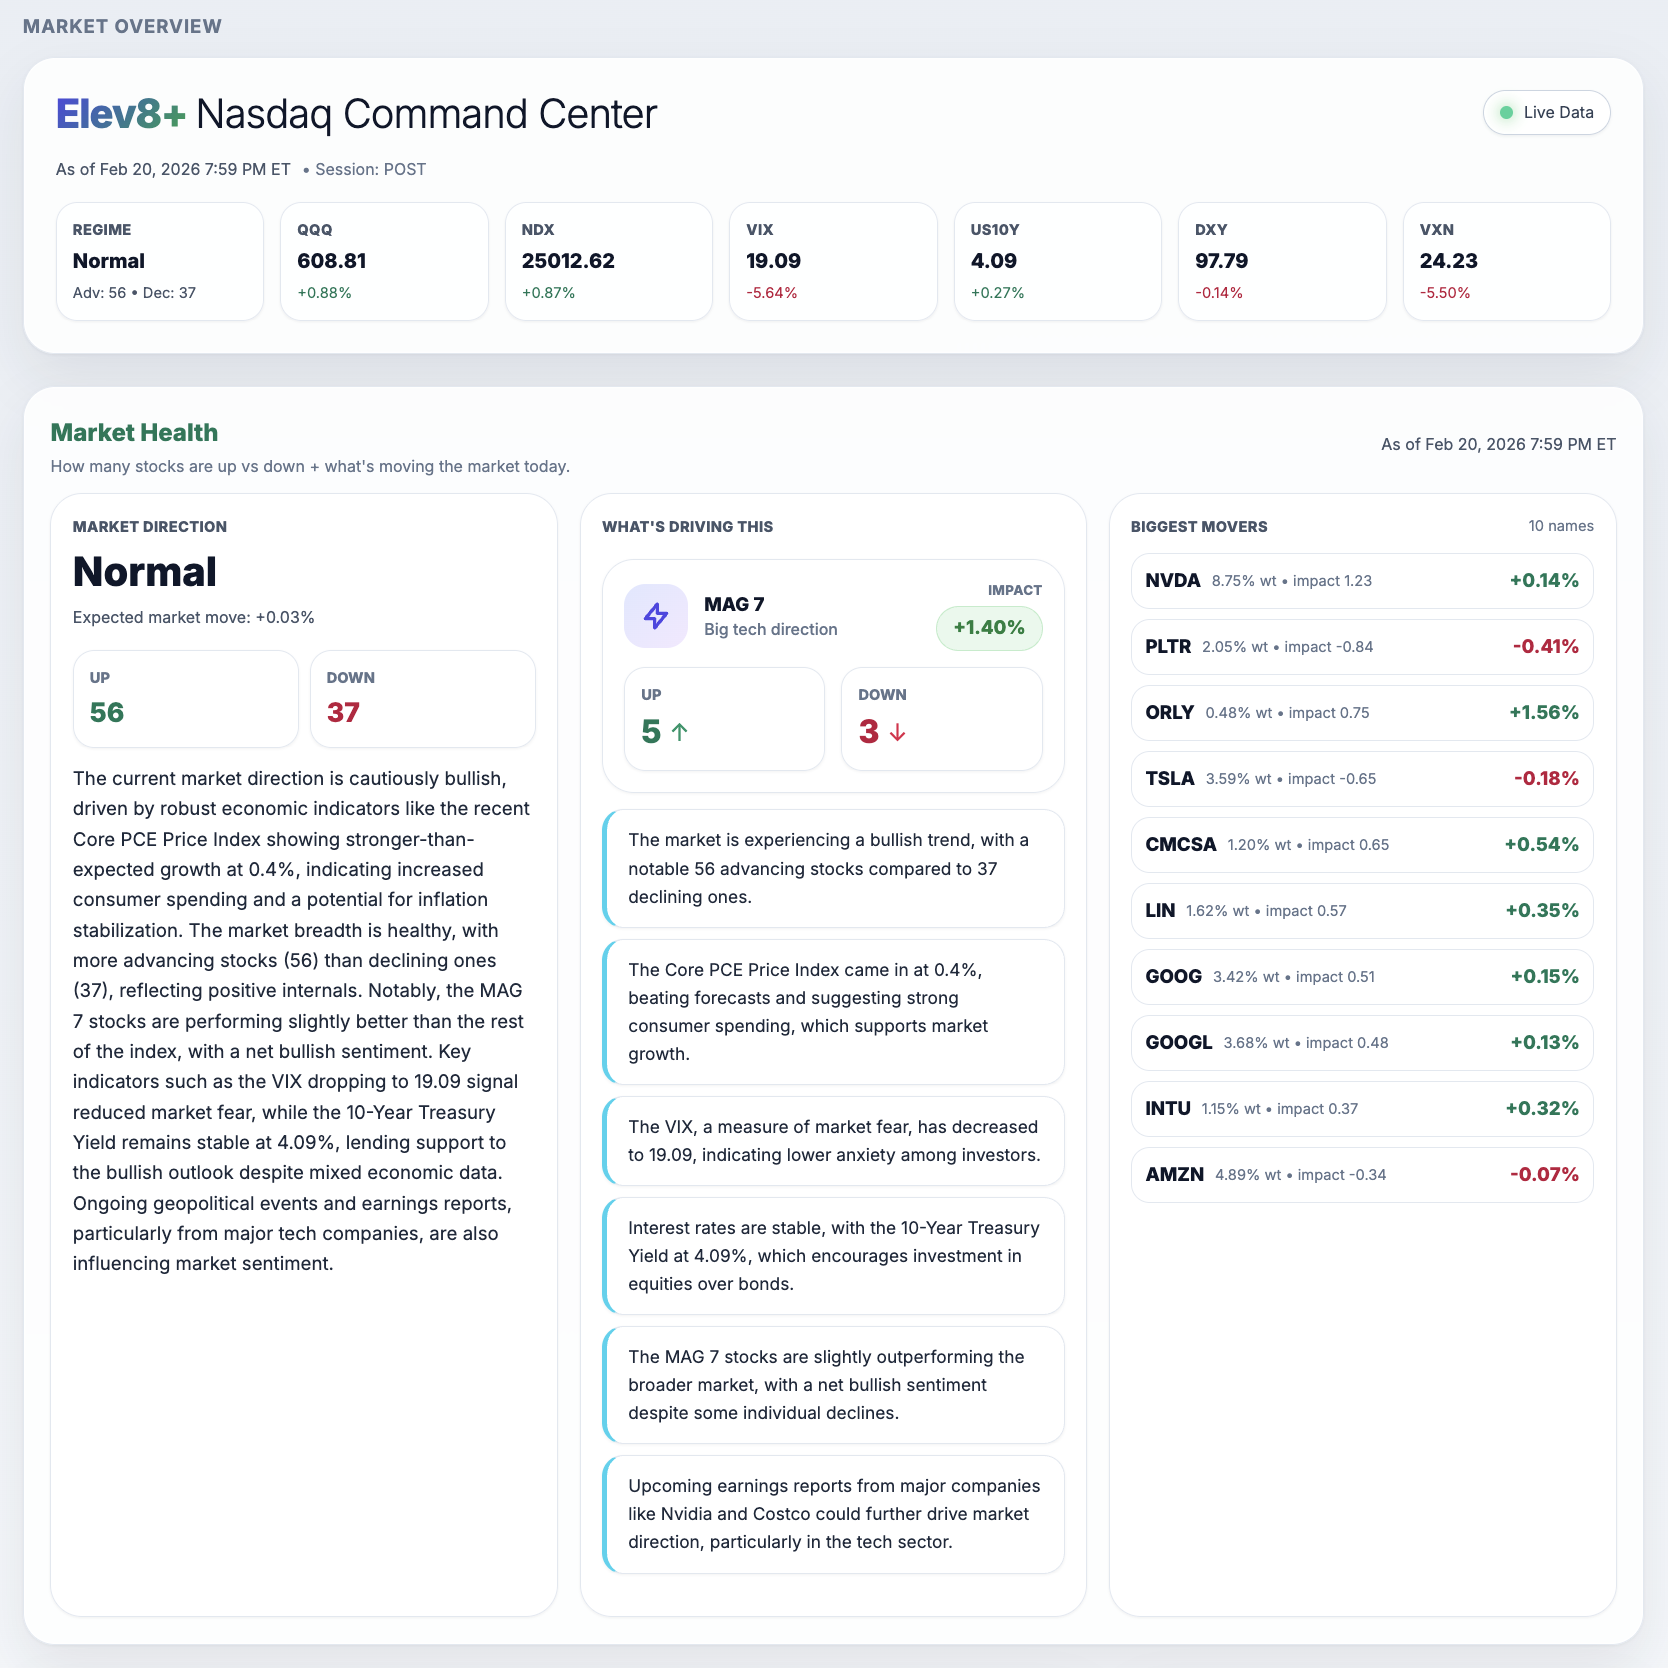
The POST label tells you this is not a premarket snapshot. Begin with that distinction before interpreting any market label.
The screenshot displays 11 stocks up and 84 down. Read those as the displayed tracked counts, not automatically the entire universe or proof of the next price move.
The MAG 7 and movers panels add context about participation and influence. The displayed impact and expected-move figures are model outputs, not guaranteed future returns.
Review market conditions and nearby levels in Market Health. Then write down what would support your market view and what would change it.
Want to see analysis on your chart? Watch the Elev8+ indicator walkthrough to compare the separate TradingView subscription.
Published by Elev8+ Trading to explain trading concepts and our products. Elev8 sells the tools linked here; these guides are not independent product rankings or personalized financial advice. Chart examples illustrate a process, not audited trading results.
Dates identify substantive content updates, not a claim of independent expert review. Check current exchange, broker, and prop-firm rules before relying on a calculation. Ask a question or report a correction.
Next Step
Use Market Health for session preparation and the free email course to learn how to read levels, signals, and potential exits.
Daily levels and context from Market Health
Free lessons on chart analysis and risk