
Who This Is For
- Traders who want one practical daily workflow for context, bias, and setup selection.
- Anyone reducing tool overload and standardizing morning prep.
- Traders who want a preparation checklist rather than a prediction.
Market Structure
Market structure describes how price forms highs, lows, and trading ranges. Start with those relationships before adding indicators or trying to name every pattern.
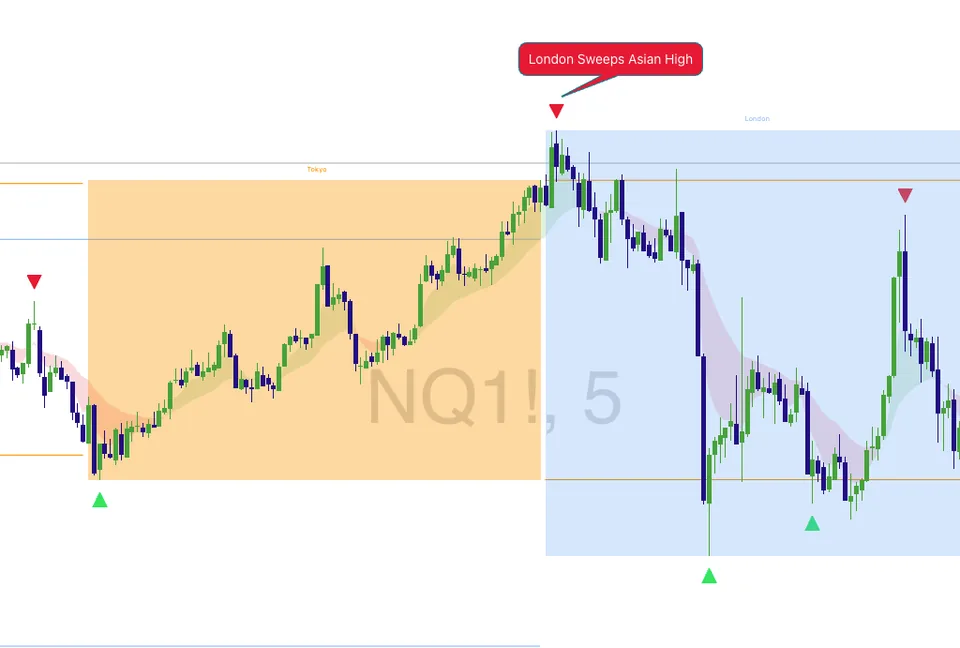
NQ intraday chart with structure and confluence overlays.
What You Will Learn
Switching between timeframes and pattern names can create conflicting views. Start with a consistent chart period and a simple definition of highs, lows, and ranges.
Work through these checks in order. The examples explain a process; they are not instructions to place a trade.
State the chart timeframe and session before marking swings. A short-term pullback can occur within a larger uptrend, so apparently conflicting descriptions may refer to different views. Avoid switching timeframes solely to find a label that supports a trade you already want.
Choose the high or low that matters to your setup and mark it before the test. Compare it with prior-day and overnight levels. Define what counts as a break in your own rules: a brief touch, a traded move beyond the level, and a close beyond it are not identical observations.
Does price continue to hold beyond the reference, or return through it? The answer distinguishes continuation from a possible failed breakout. One wick can be ambiguous. If the confirmation sequence is missing, leave the setup incomplete instead of assigning a stronger label.
Write the condition that would contradict the setup before considering size. After the session, save the reference, sequence, planned stop, and result. Include losing and skipped examples so the review is not simply a collection of attractive reversals.
Suppose price breaks an overnight high, pulls back toward it, and then holds above it under your written rule. That is different from a quick move above followed by a return below. Define the acceptance condition beforehand; neither pattern guarantees the next move.
One smaller bounce after a sharp rise does not automatically establish a durable downtrend. Check the low that your plan treats as significant and whether it has actually broken. If the evidence is mixed, a neutral description is more accurate than forcing a directional story.
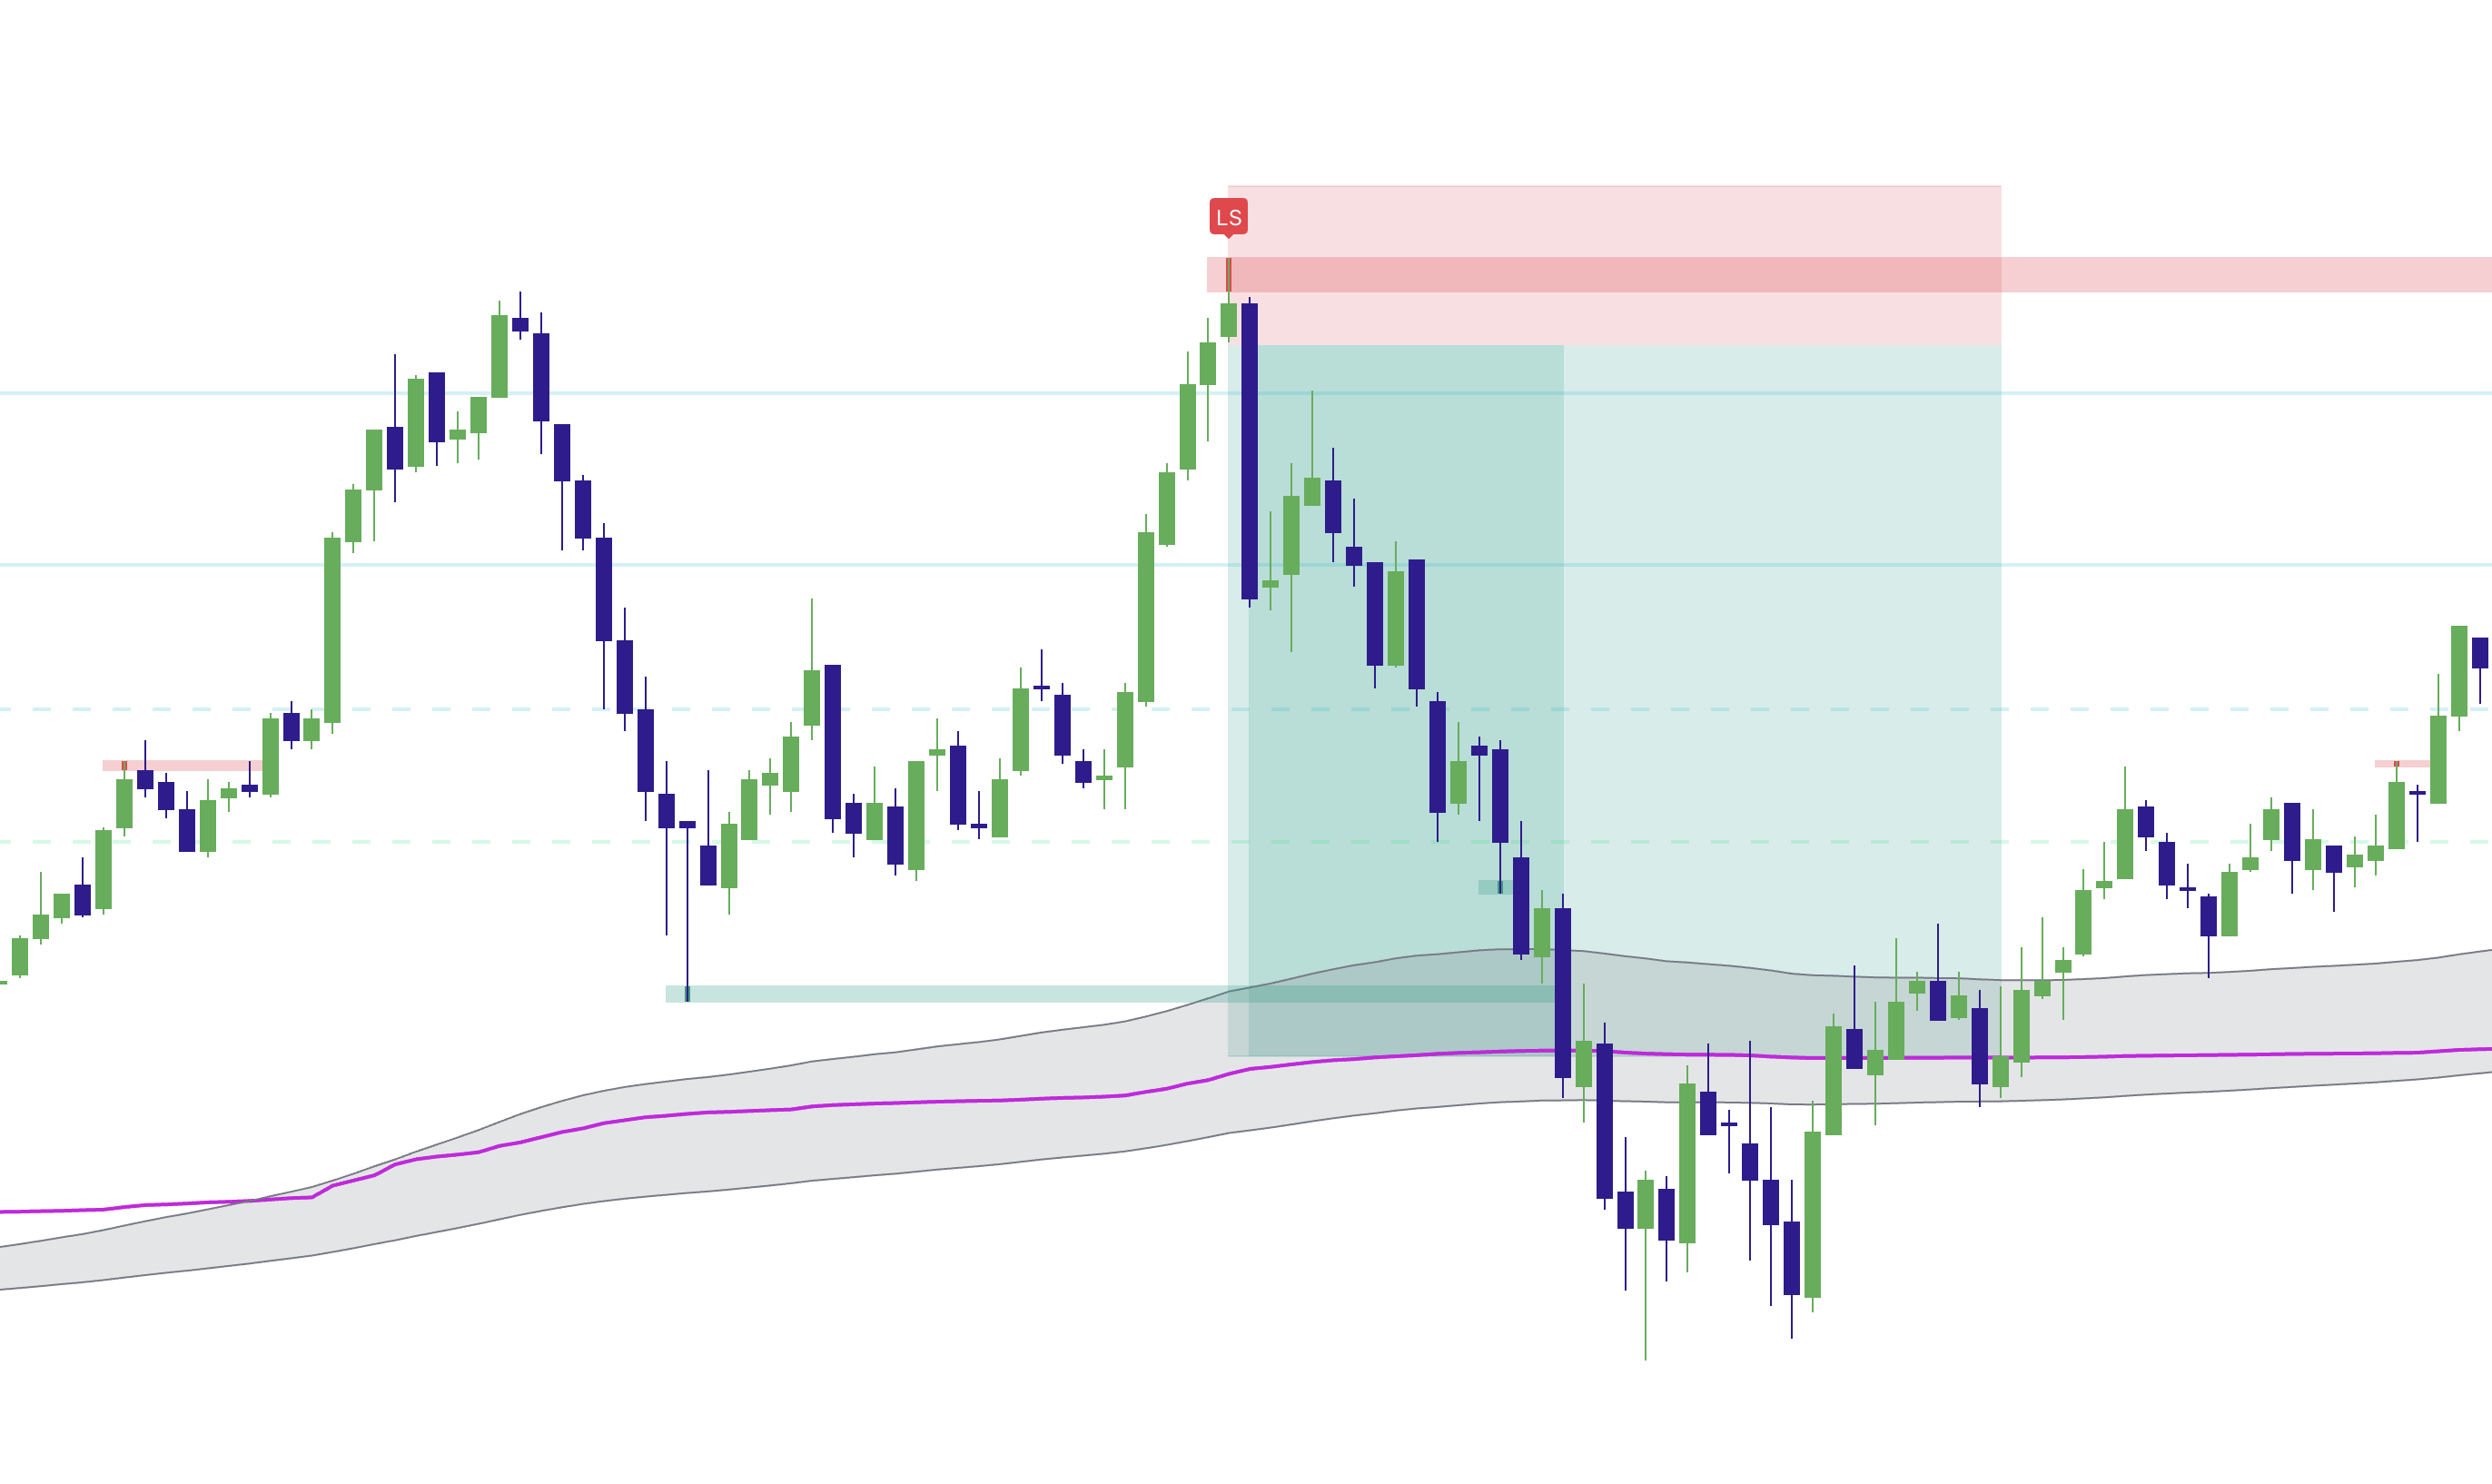
The earlier peak supplies context for the later test. Identify the reference before evaluating the later marker.
The marked move crosses the prior high and is followed by a decline. Study the price sequence, not just the presence of the label.
An illustrated entry, stop, or target does not establish the prices a real account could have filled. Include failed examples in your review as well.
Use Market Health for a broader market overview while you study highs, lows, and ranges on your chart. The two views answer different questions.
Published by Elev8+ Trading to explain trading concepts and our products. Elev8 sells the tools linked here; these guides are not independent product rankings or personalized financial advice. Chart examples illustrate a process, not audited trading results.
Dates identify substantive content updates, not a claim of independent expert review. Check current exchange, broker, and prop-firm rules before relying on a calculation. Ask a question or report a correction.
Next Step
Review conditions in Market Health, then use the free email course to learn about price levels, entry signals, and risk planning.
Daily context and level mapping
Lessons on planning and reviewing trades